On this page, you'll learn how to export data from the SEED Map through:
- simple download
- using the identify by rectangle tool
- using the clip and export tool, or
- using the switch results view tool.
Simple download
Start by selecting the data or region/area of interest on the SEED map by:
- Using simple search (keyword search, filters or adding layers from catalogue to find data in SEED)
- Using advanced search or query syntax
- Finding data in a local area using spatial search
- Using the clip and export tool.
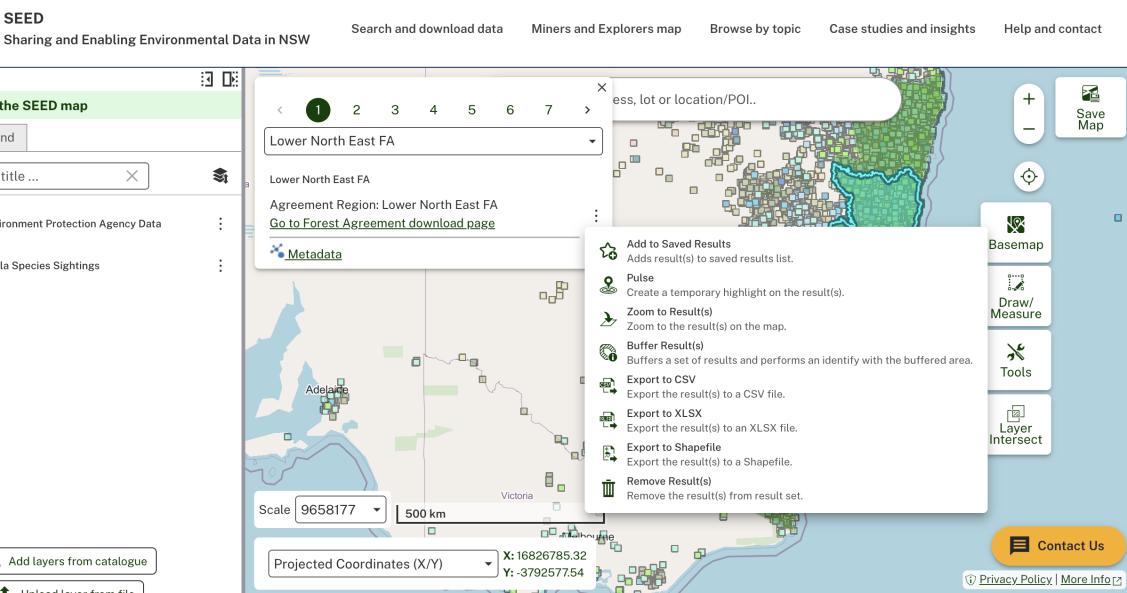
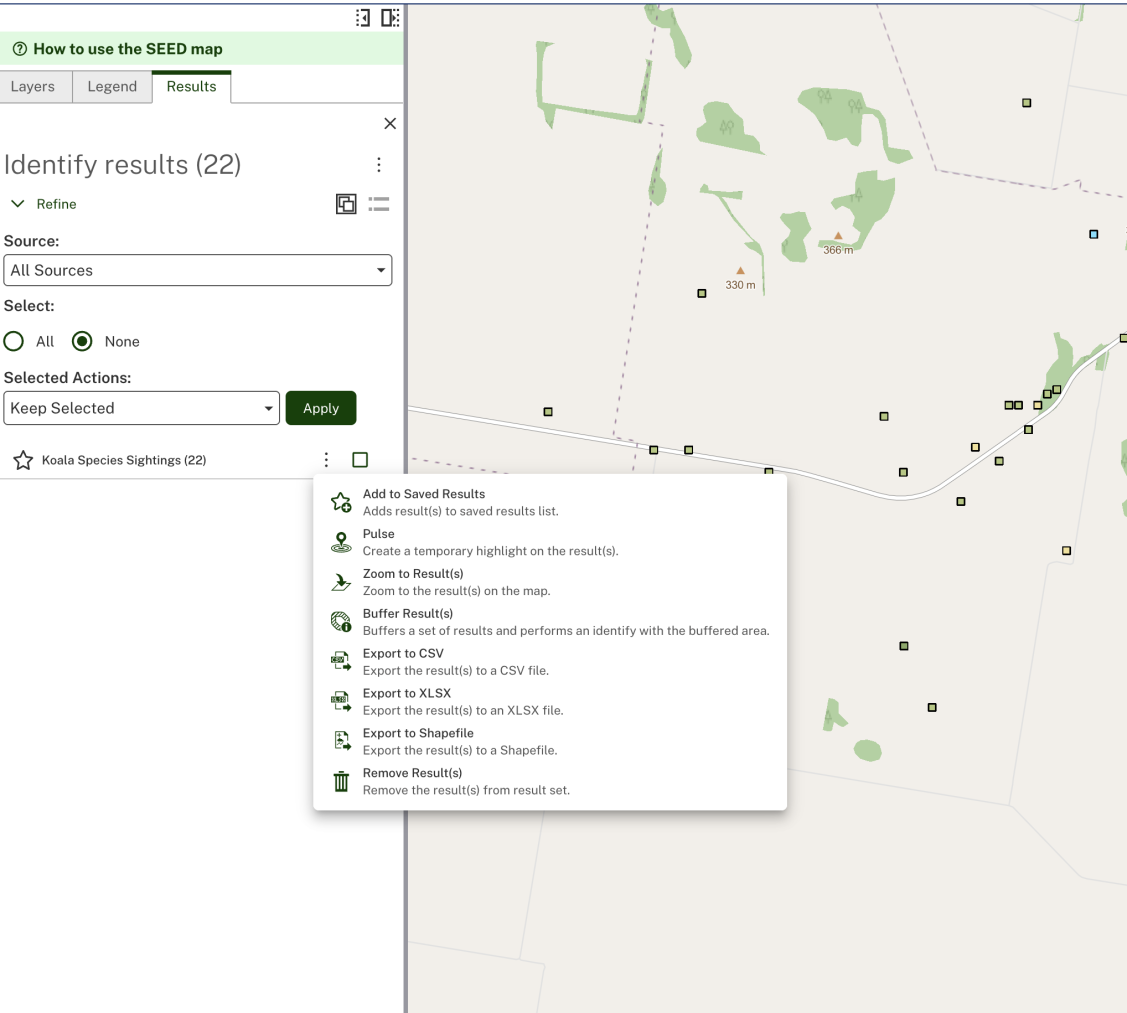
Once the data or area is selected, click the three dots on the result and select the export format you need (XLSX, CSV or Shapefile).
Using the identify by rectangle tool
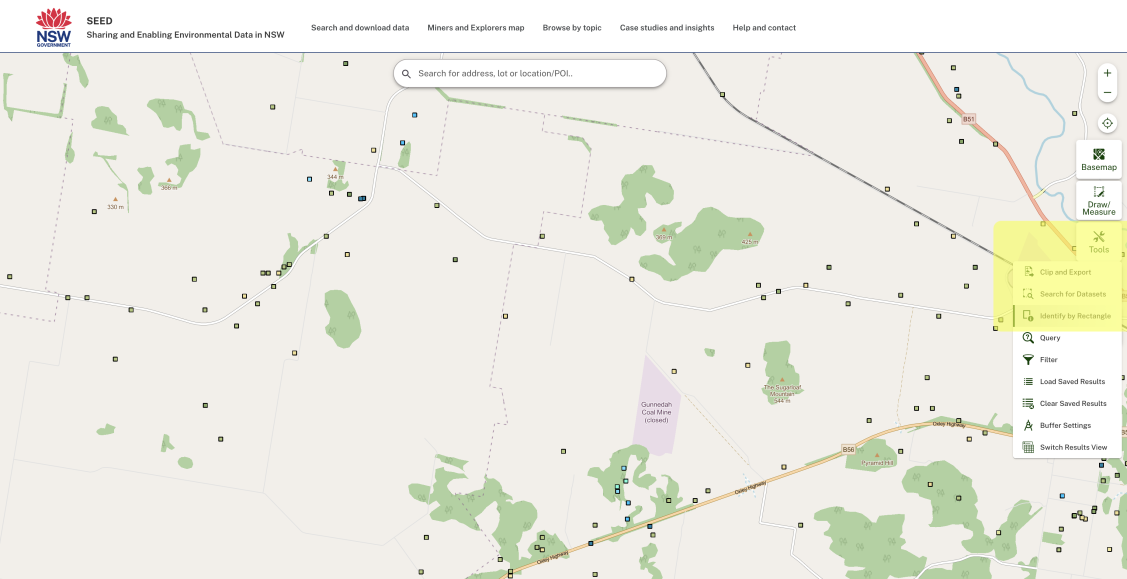
Click Tools
Click Tools and select ‘Identify by rectangle’.
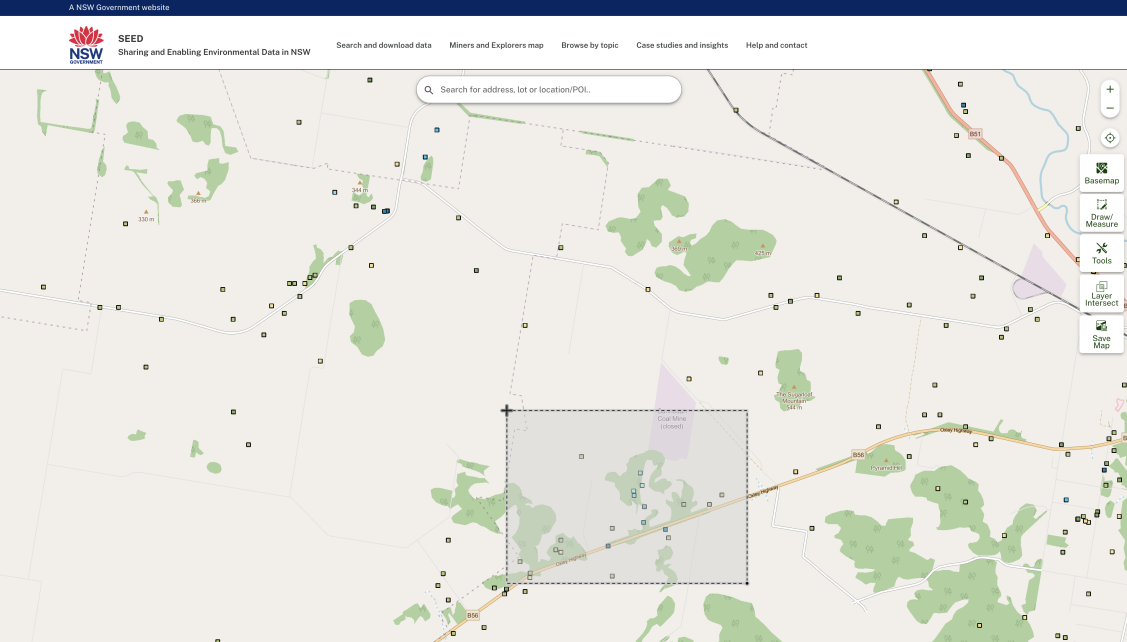
Now when you hover over the map your mouse will turn into a crosshair.
Select the area
Click and drag over the data area you want to export.
See your results
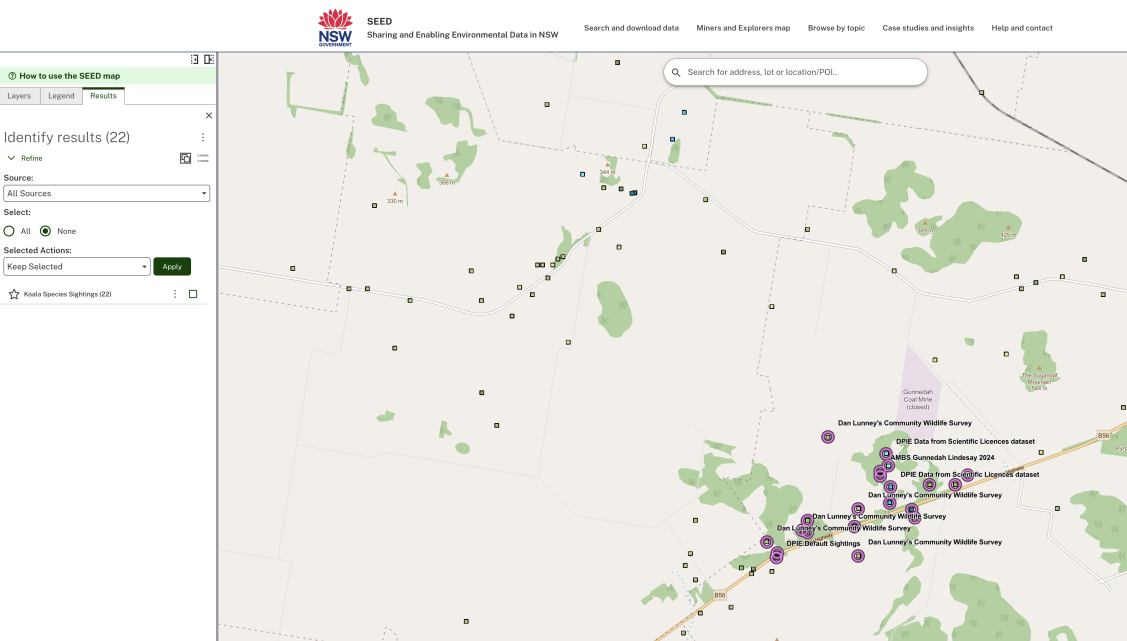
The results will highlight on the map and populate in the left-hand panel.
Select your format
Click the three dots of the result you want to export and select the format you want to export (XLSX, CSV, Shapefile).
The map will notify you if a layer exceeds the 500-result limit.
Using the clip and export tool
Find the data in SEED Map
To use the tool you must first have found the data you need in the SEED Map.
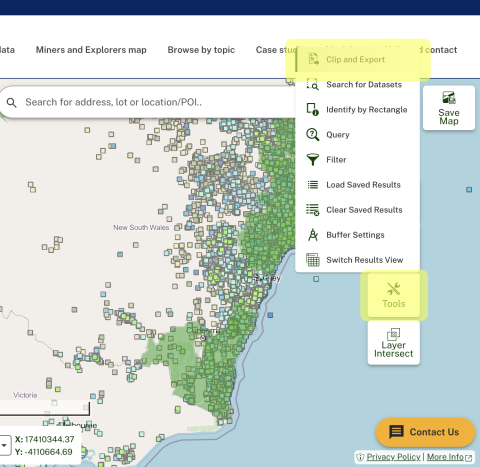
Select ‘Tools’ then ‘Clip and export’.
Define your area
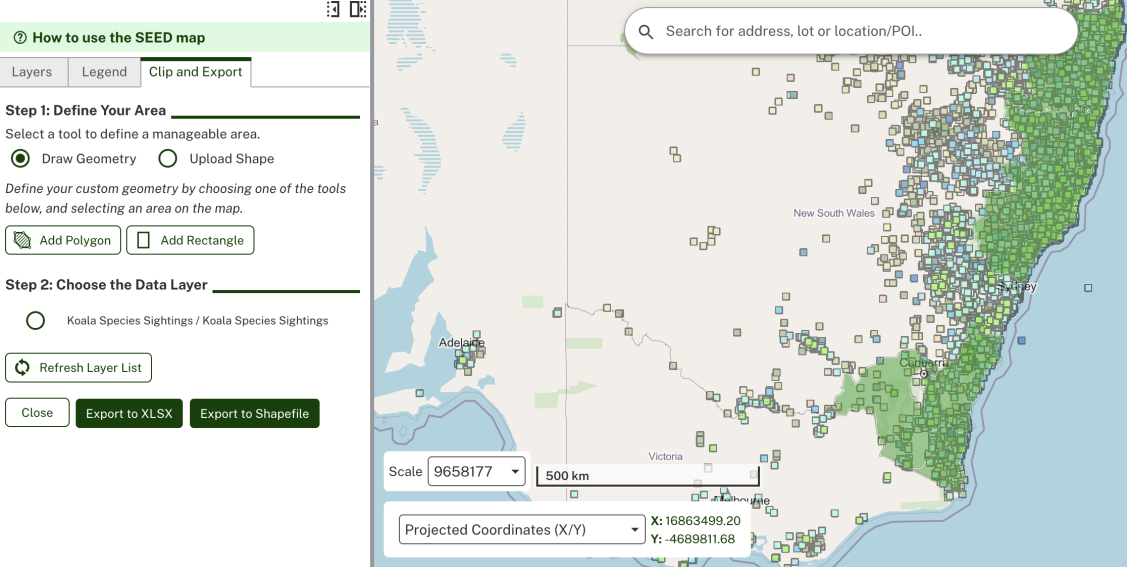
Define your area by choosing Draw Geometry or uploading a shape for the map area you want to export.
The maximum allowed limit is 50000 ha.
Choose your data and export
Choose the data layer you want to export.
Select the export file type (XLSX or Shapefile).
Using the switch results view tool
The switch results view tool turns visual data into a simple, ordered table format you can download. You can use this tool whenever multiple map features are selected. Use the Identify by rectangle tool.
To use the switch results view tool
- Select ‘Tools’ then Identify by Rectangle and select the map features
- Select ‘Tools’ again then
- ‘Switch results view’
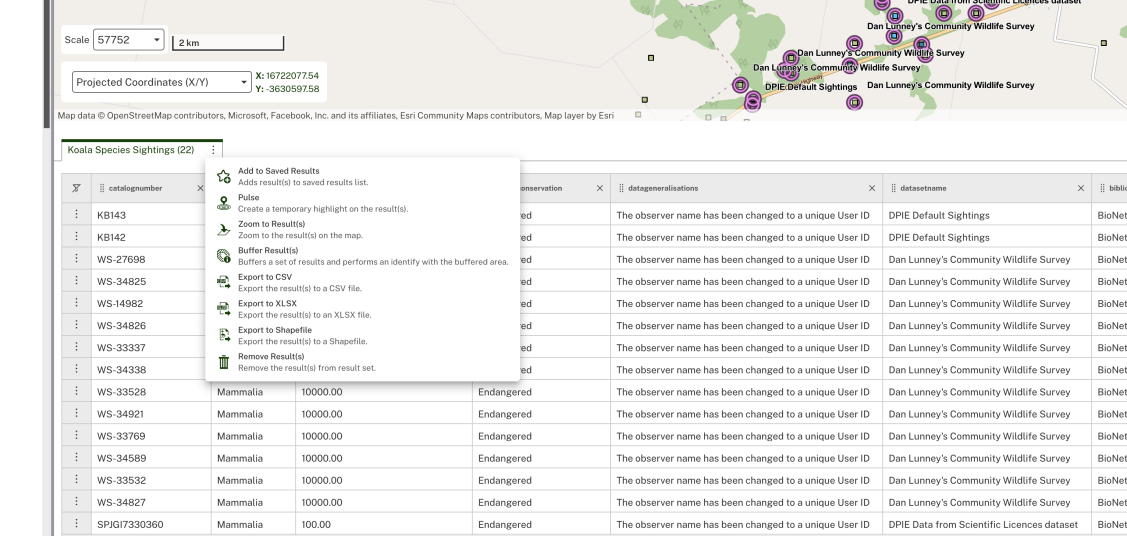
- A table will populate under the map. You can scroll through the table.

To export, click the 3 dots on the table tab you want to export and select the format you want to export (XLSX, CSV, Shapefile).
Requesting data without an export option
Some SEED datasets need to be requested from the data custodian. Navigate to the metadata page to click 'Contact Data Broker'.