Finding and using data on the SEED map
Overview of SEED map Features and Functions
Overview of SEED map Features and Functions
This page provides an overview of the main features and functions on the SEED map, including:
- Moving around the map
- Using the ’I want to‘ menu
- Using the left-hand panel
- turning datasets on/off
- changing the transparency of a dataset
- Changing the base map
- Adding Spatial Services data
- Viewing scale and coordinates
- Zoom to visible scale (Panel Actions Menu button)
- Annotating the map (adding text and shapes)
- Adding a buffer to select data points by location
- Measuring area and distance
- Exporting and printing the map
Moving around the map
To zoom in and out on the map (increase and decrease the magnification) you can:
- use the + and – buttons on the map
- use the mouse wheel
- double-click (or double-tap on a mobile device) to zoom in.
To reposition the map, click (or tap) on it and drag it to the new position.
To centre the map around a particular point, right-click on the point and select ‘Centre the Map Here’ from the pop-up menu.
Can't see the data? Some datasets only become visible at certain magnification levels. If you cannot see a dataset (after giving it a few seconds to load), try zooming in or out (or see ‘Zoom to visible scale’ below).
Using the ‘I want to…’ button
|
The ‘I want to…’ button (top left-hand corner) is your starting point to search for locations and datasets. The options under this button are described on the page Finding locations on the map. |
Using the left-hand panel
The panel to the left of the map changes according to what you are viewing or the function you are using.
If there is data displayed on the map, a Legend provides descriptions of symbols and colours. To switch to the ‘Layers’ listing of all datasets currently on the map (grouped by organisation), click on the Panel Actions Menu button and then select ‘Show Layer List’. The Panel Actions Menu button is depicted by four horizontal lines at the top of the left-hand panel.
From the Layer List you can turn datasets on or off, as well as change the opacity (transparency) of a layer by adjusting the slider that is adjacent to the dataset’s name. If you click on the arrow next to the dataset you may also have the option to zoom to full extent, zoom to visible scale, view the metadata, or remove the layer from the map (the options will vary depending on the dataset).
To return to the Legend, click on the Panel Actions Menu button and select ‘Show Legend’.
If you use options from under the ‘I want to…’ button, corresponding tabs are added to the bottom of the left-hand panel. This enables you to easily re-use those functions. These tabs include Location search, Previous search and Dataset search.
For more information about using the left-hand panel, see Finding locations on the map.
Changing the base map
Select the base map switch button in the bottom left-hand corner of the map to change the base map - several topographic and imagery options are available for your use:
Adding Spatial Services datasets (formerly LPI)
The SEED map can be overlaid with various layers from NSW Spatial Services, including administrative boundaries (suburb, electoral, cadastre) and points of interest (such as significant buildings).
These are available as datasets within SEED, which you can find by selecting ‘Dataset catalogue’ on the SEED menu, and then filtering by Organisation - select ‘Spatial Services’.
Alternatively, to add them from within the map, open the Layer Catalog (from the 'Tools' toolbar) and select the required datasets from those listed under ‘DFSI - Spatial Services’. This is described in Finding locations and data on the map, under the heading 'How to find and display datasets on the map':
Viewing Scale and Coordinates
|
The 'XY' and '1:500' buttons at the bottom of the map can be used to display Coordinates (latitude / longitude) and a Scale selector. |
Coordinates: Select the 'XY' icon to see the latitude / longitude of any point where you place your mouse cursor. An alternative method is to right-click on a point on the map. This displays a pop-up menu with the coordinates shown at the top.
It is possible to do a search using GPS coordinates, if you have the lat/long coordinates of a point. Right click on the map, and then select ‘Plot a Coordinate’. This will plot the coordinates of the point where you clicked, but it also enables you to enter your own coordinates. The plotted coordinates will now be displayed in the left-hand panel - if you click on the 3 dots next to the coordinate here, and then select Edit, you can type in any coordinates that you want, as well as add additional points. To zoom to one of your entered points, double-click on that point in the left-hand panel.
The Scale indicates the relationship (ratio) between distance on the map and the corresponding distance on the ground. For example, a ratio of 1: 72,224 indicates that 1cm on the map equals 72,224cm (or 0.72km) on the ground.
|
The linear scale bar can be used to give an approximate indication of distance, by positioning the feature you want to measure above the bar. For a more accurate measure, use the Distance Tool, described under the heading Measuring area and distance on this help page. |
Zoom to visible scale
Some of the datasets in SEED only become visible at certain zoom levels. This is particularly the case for very large datasets that are too slow or too detailed to display if you are zoomed out too far. If you have added a dataset to the map and it isn’t displaying you can ‘zoom to visible scale’, which will automatically zoom to the scale that is required for that dataset to display. To do this, click the Panel Actions Menu button (with the four horizonal lines) at the top of the legend panel, and select Show Layer List. Then click on the arrow ( > ) to the right of the layer name. You can then ‘Zoom to full extent’, or ‘Zoom to visible scale’.
Annotating the map with shapes and text
Click on the Panel Actions Menu button again to return to the legend.
You can quickly add a point or some text to the map by right-clicking on the map and then selecting either ‘Draw a point’ or ‘Add some text’.
For more options, expand the ‘Tools’ menu and then click on the arrow next to the ‘Point’ tool. This will give you the option to add text and various shapes. Click (or tap) the point on the map where you want to add the text/point/shape. If the shape you are drawing has several points (such as a polygon), continue to click until you have defined each edge. Then double-click to stop drawing. You can also change the symbology (style/colour).
If you are using ‘Tools’ button option, the tool will stay activated until you deselect it by clicking again on the Tools button.
How to add a buffer around a location or data feature
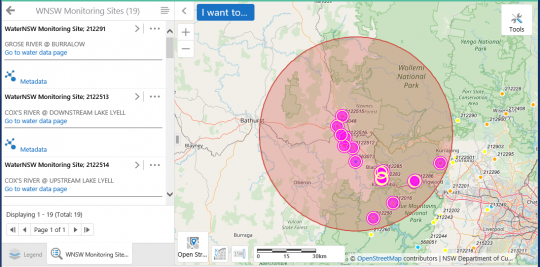
A buffer is a zone of a specified distance around a location or dataset feature. For example, in the following diagram, a buffer of 50km radius has been defined around the location point ‘Lithgow City’, and used to see water monitoring sites within that radius:
To define a buffer, first display one or more datasets, then use the 'I want to...' button to search for a location.
Then, in the left-hand panel:
- select one of the listed locations
- select the menu button (depicted by four horizontal lines), then 'Show Buffer Options'
- enter a Distance for the buffer
- select the 'Continue' button.
Measuring area and distance
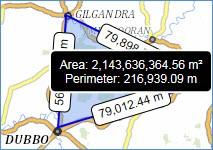
To draw a line or shape and measure its length or area, select the ‘Tools’ button then ‘Distance/Area’. Click (or tap) on a point on the map to start, then double-click to end. Once the area is displayed you can change the unit of measurement (eg metres / kilometres / hectares / m2).
If you enable Snapping then your line will snap to an existing feature, so you can draw it more accurately.
Exporting and/or Printing the map
The Tools menu contains both an ‘Export’ and a ‘Print’ option.
If you select ‘Export’ then you have the option to save the current view in various formats, including BMP, JPEG, PNG, TIFF, GeoTIFF and PDF. Your map will not have a title or scale bar.
If you select ‘Print’ then a map will be created using a standard map template which includes a scalebar. You can give your map a name, change the resolution, and save it in either PDF or PNG format.
To perform either of these tasks, expand the ‘Tools’ menu and then select either ‘Export’ or ‘Print’:
Providing feedback on the SEED map
Users can provide feedback on the SEED map, datasets, and tools, including general functionality and missing datasets. This can be done directly on the SEED map while having your data layer area of interest loaded.
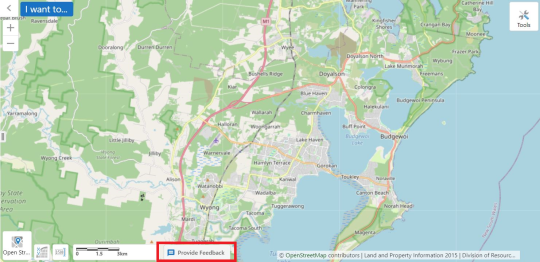
Click the ‘Provide Feedback’ button, located on the bottom of the map.
Select ‘General SEED’ for feedback related to general functionality, or ‘Dataset content’ for dataset feedback.
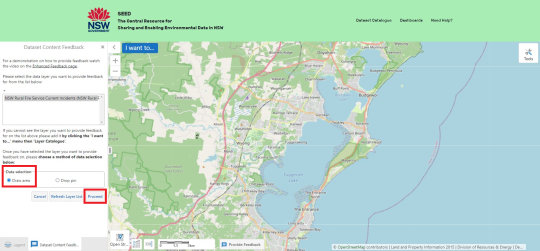
For ‘Dataset content’ feedback, you can select the dataset and define an area of interest using the draw button on the left panel, add mark-ups and text to provide a detailed description of your feedback.
The current map view will be attached to your submission, and you will receive a unique code to follow up on your feedback.
The video below demonstrates how to provide comprehensive feedback, including ways to draw area, insert mark-ups, descriptions and attach supporting files.


