On this page, you’ll learn how to use the SEED Map Layer Intersect tool to:
- draw an area of interest
- identify and analyse specific map layers for the area of interest, and
- download simple or detailed reports.
What is the Layer Intersect tool?
Layer Intersect is a SEED Map tool that lets you:
- analyse environmental data in specific areas of NSW
- see where different data layers overlap, and
- download reports with the results.
Steps to use the Layer Intersect tool
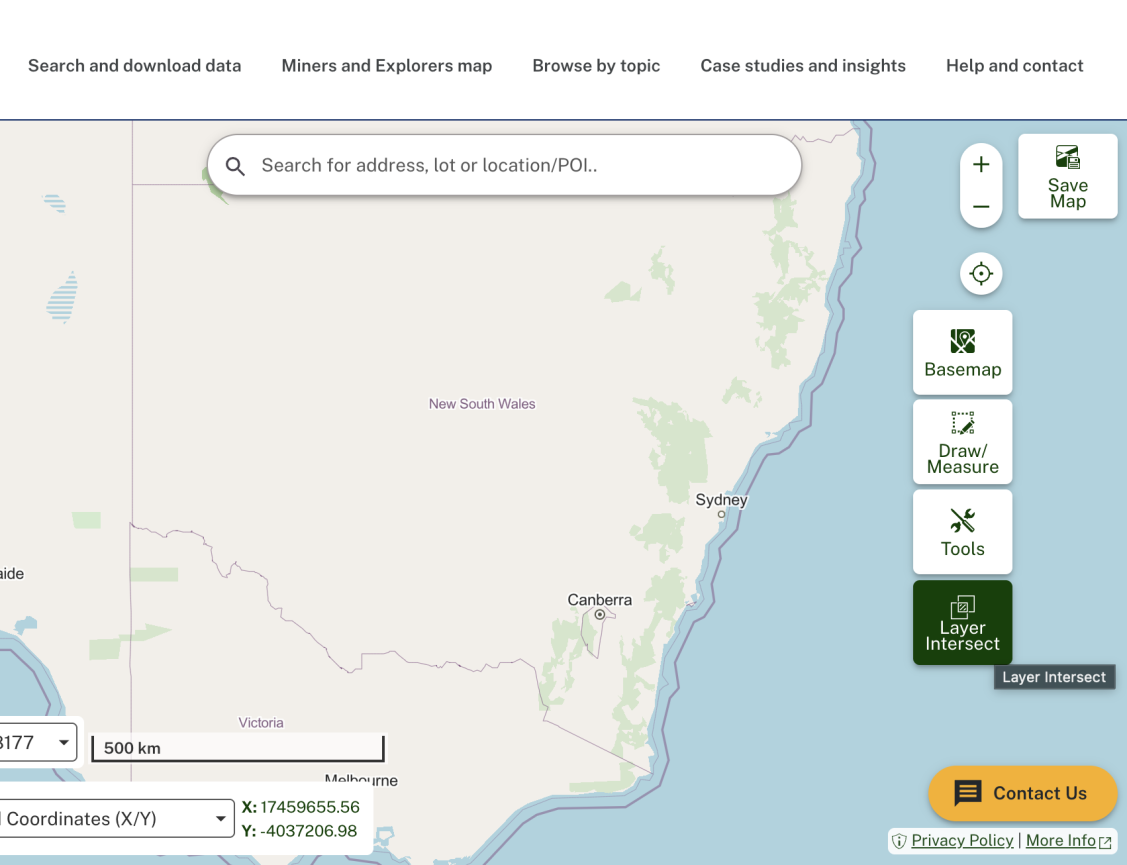
Click the ‘Layer Intersect’ tool button on the SEED map
Select your layers
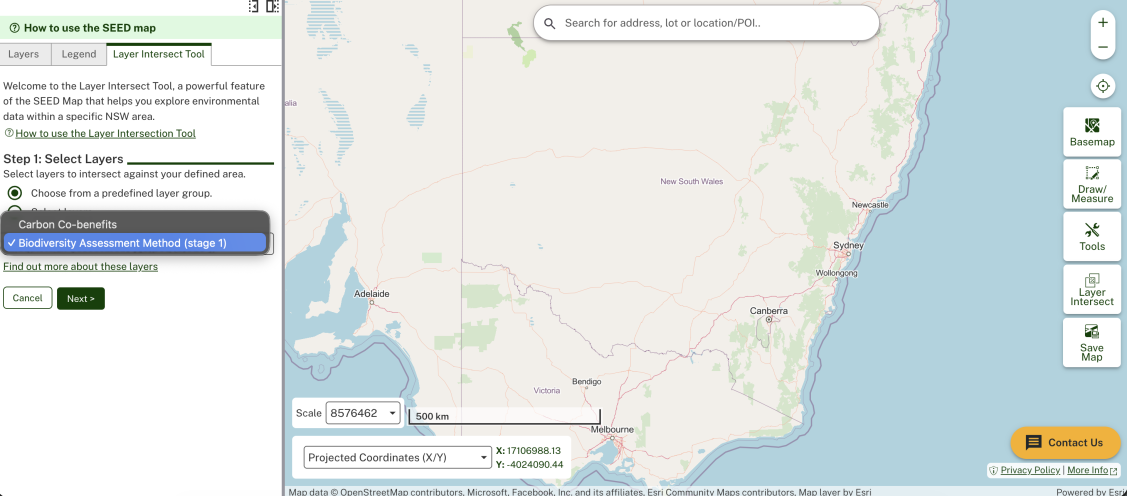
Option 1: Predefined group of layers
Select from a predefined group of layers
Option 2: Search and select from a list of layers
You can also select layers by searching and selecting from a list of layers. Only feature layers are supported. Now you've selected your layers, select ‘next’.

Define your area of interest by selecting one of the 3 options
Option 1: ‘Draw geometry’ with a rectangle or polygon shape

Option 2: Upload a zipped Shapefile
This should be a zipped folder with a .shp, .dbf and/or .prj file types
Option 3: Select a location
- Select the ‘primary information layer’ from the dropdown list
Choose from Lot, National Park, Planning District Boundary, Suburb or Local Government Area

- Type the location into the search bar, or click ‘select on the map’ to select the specific area.

Select the report type
Simple reports are best for large area analysis and when a detailed report is not available
Detailed reports include all available data, such as:
- PDF reports with map and summary tables showing the areas where each layer intersects,
- CSVs of the area of each feature that overlaps with the layers in the attribute table.
They need a buffer distance input between 1 and 2000 meters to the area of interest.
- After inputting the buffer distance, click ‘run feasibility report’ to ensure the report can successfully run. Click next.
- If the feasibility report fails click ‘previous’ and zoom into the map or choose a smaller area for your study.

Add text to the report (Optional)
You can add your own analysis to include in the PDF summary report of your download (max 2000 characters). This text will appear after the map and before the interest tables.
Run report, print and/or download the report
- Click ‘run report’. The report can take up to 5 minutes to generate. Do not refresh or close the map during this time.
Once the report has run you can choose which layers to display on the map. All intersected and non-intersected layers are included in the report. The intersected layers will appear. Non-intersected layers have been analysed, but don’t fall within the selected area of interest.
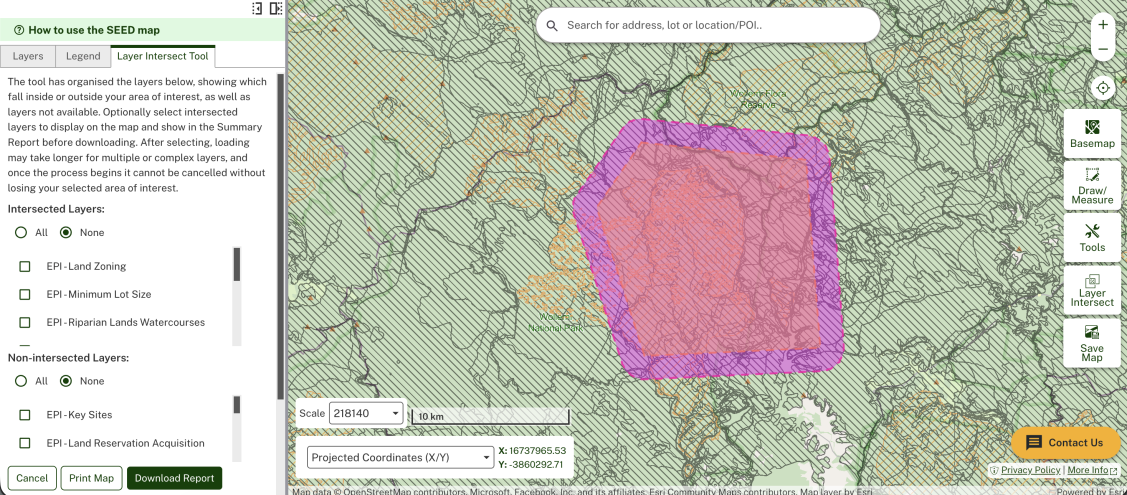
- You can print the map as many times as you need with individual layers or all layers.
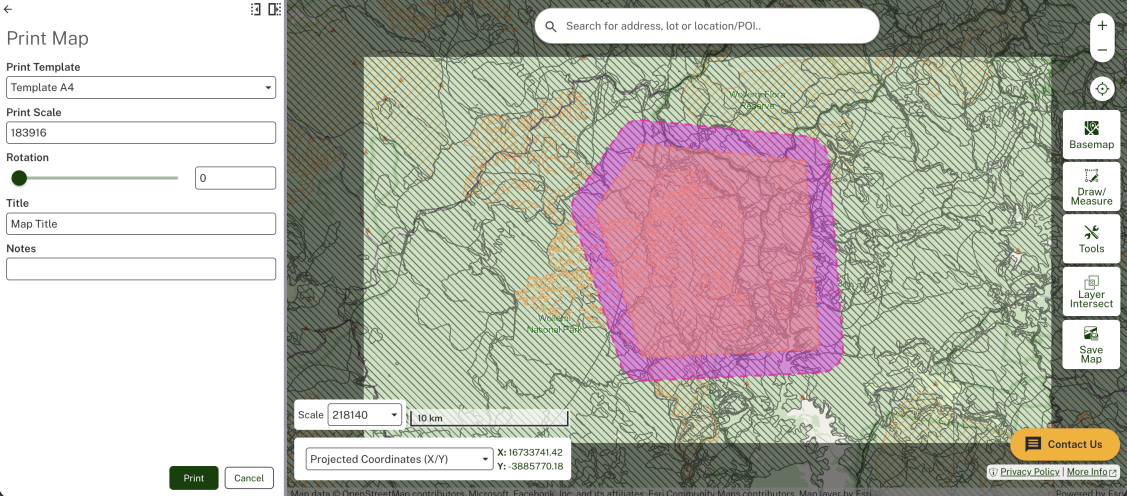
- Download the report by clicking ‘download report’. If you have turned on map layers they will be displayed in the printed map in the report.
A pop-up will appear when the report is ready to download. Click to download the report to access it.