Search

Habitat Intactness and Neighbourhood Habitat Intactness updated to 2023

Published on 25 February 2026

Habitat Intactness and Neighbourhood Habitat Intactness indices were recently updated with new data that extends their coverage from 2017 to 2023. These layers support regional and state-scale reporting by providing our best state-wide estimates of habitat condition using satellite data at each 90-metre (grid cell) location across NSW.  

Habitat Intactness measures the quality of terrestrial habitats by estimating how intact habitat at each location is relative to a natural unmodified state. Neighbourhood Habitat Intactness considers how habitat loss and fragmentation effect the ability of species to move throughout the landscape by also measuring the connectivity of each location to surrounding habitats. 

The Biodiversity Indicator Program, State of the Environment and NSW Performance and Wellbeing reports use these layers as indicators of ecological condition and ecological carrying capacity. These indicators report the effectiveness of terrestrial habitats in supporting native species and ecosystems across the State. 

This update shows Habitat Intactness increasing across NSW by nearly 1% in 2023, with improvements of 2-5% across bioregions that were most impacted by the 2019–20 bushfires and preceding drought.  

Recent improvements allow for annual reporting but with a two-year time lag due to underlying data requirements. We’re also hindcasting these indices back to 1990, where available data permits. These measures can be adapted to support near real time, but less complete, monitoring when more recent insights are needed, as per the 2019–20 bushfire impact assessment. Both layers are now available to explore on the SEED Map. 

Contact [email protected] for more information. 

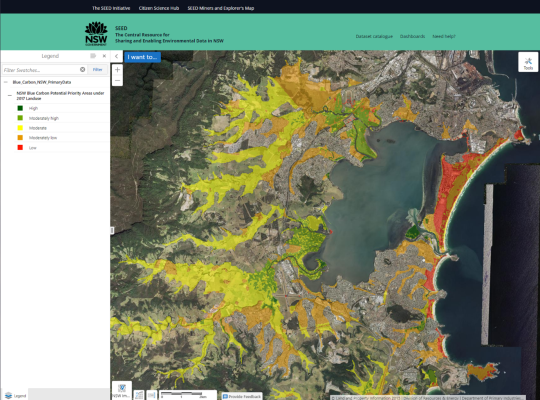
Habitat Intactness updated to 2023 -map


Biodiversity Credits Market Sales Dashboard

Published on 1 September 2022

Yass Daisy

The Biodiversity Credits Market Sales dashboard is now available on SEED.

This dashboard contains data relating to all biodiversity credits created under the Biodiversity Assessment Method (BAM). It is a searchable, visual tool that allows users to view historical sales and market trends, in a single location.

The BAM Sales Dashboard presents a market overview, the latest prices for ecosystem credits and the latest prices for species credits. It can be used to support:

  • considering the feasibility of a Biodiversity Stewardship Agreement
  • business planning for developments
  • costing or pricing biodiversity credits.

You can find more resources including example scenarios and uses, FAQs and user guides on the dashboard page.

There is a short survey on the final page of the dashboard. Your feedback is important to us and will be used for continuous improvement. Please submit your feedback via the survey.

Watch the video below to see a comprehensive demonstration on using the dashboard.

Download a copy of the video transcript

[Header image: Laura Canackle/DPE]

NSW Net Zero Emissions Dashboard

Published on 12 August 2022

Muswellbrook Clean Air Project

The NSW Net Zero Emissions Dashboard is now available on SEED.

The dashboard provides detailed insights into NSW emissions trends from the past, now and into the future, and how NSW is tracking toward our Net Zero emission targets.

It presents information on the different sources of emissions in NSW and how they contribute to different greenhouse gases over time.

It also provides detailed emissions data for local government areas, which is the first comprehensive local-scale greenhouse gas emissions data published across NSW. You can explore emissions data in your local area to understand sources and trends of greenhouse gases.

The NSW Net Zero Emissions Dashboard will assist state government, local government and industry sectors to assess the impact of their emission reduction programs over time and target initiatives that will have the greatest contribution toward reducing local emissions.

Access the dashboard here.

Two videos are available to watch:

  • How to navigate the NSW Net Zero Emissions Dashboard
  • NSW Net Zero Emissions Dashboard – Report contents


[Header image: John Spencer/DPE]

How does data help shape what we grow in the future?

Published on 25 February 2026

cherries - copyright DCCEEW

Until recently, climate data and supporting interpretation have been hard to access, difficult to compare across regions and commodities, and challenging to translate into real‑world planning.

For the people making decisions about land use, food security and biosecurity risks, the evidence was not always available.

The NSW Government’s Climate Vulnerability Assessment for Primary Industries project has changed this.

One small, multidisciplinary team has translated complex climate science into a consistent, statewide evidence base that planners, industry and government can use.

The result is a detailed analysis of climate risks and opportunities across key commodities and biosecurity threats, built through years of modelling and collaboration with more than 260 industry, academic and government experts.

Crucially, the data won’t stay locked inside reports.

By making the Climate Vulnerability Assessment data freely available on SEED, the NSW Government’s platform for Sharing and Enabling Environmental Data, these insights can be downloaded, mapped and used by others.

Planners can pull the spatial layers into their own systems. Industry participants can test future scenarios. Academic researchers can build on a shared, comparable baseline.

“Our team came from different academic backgrounds, but we shared the same frustration – finding valuable data and not being able to access it,” says the Climate Vulnerability Assessment Acting Project Manager, Dr Jane Kelley. “As scientists, we wanted to provide open‑access data, because that’s what helps us all make better decisions about the future.”


What the data tells us

Understanding how a commodity or biosecurity risk responds to climate – and which variables matter most – is complex.

Take Cherries. The results show that cherry growing in NSW is likely to remain well‑suited to the climate through to 2050, but not without some adaptation. Warmer winters may reduce the winter chill cherries need to set fruit, and hotter conditions close to harvest can affect yield and quality. For growers, this may mean choosing different varieties, improving water management and using shade or protective covers to manage heat. At the same time, warmer temperatures could make new areas suitable for growing cherries and expand the industry.
 

Forestry provides another clear example. Before the Black Summer bushfires, NSW had more than 300,000 hectares of softwood plantations, with Radiata Pine contributing around $3 billion to the economy each year and supporting thousands of regional jobs. The Assessment shows that hotter and drier summers may reduce suitability for young trees in some areas, while warmer winters may reduce frost risk and create opportunities in others.

“With data that shows us how the plantation estate may change out to 2050, forest managers can think strategically about replanting, management practices and building resilience under future conditions,” says Jane.

Biosecurity is another important application. The Assessment covers risks such as crop diseases, horticultural pests, invasive weeds and livestock parasites. In the case of the Cattle Tick, the Assessment found that rising temperatures are likely to expand the areas where the parasite can survive. “That evidence helps us evaluate current biosecurity policy and consider how it may need to change in the future,” Jane notes.

Planning is a further example. Spatial layers published on SEED can be downloaded directly into Geographic Information Systems, allowing users to map and analyse the results of the Assessment alongside land use and hazards. “Agricultural planners can assess zoning decisions in the context of industry presence and climate suitability out to 2050,” she says, and this supports clearer, more defensible decisions about agricultural activities and where productive land should be protected to support future food security.


From evidence to confidence

To create a statewide picture of climate risk and opportunity, historical climate records and future projections were combined with expert knowledge drawn from research literature, departmental specialists and industry practitioners.

“We engaged with more than 260 experts at key stages of the project to help define the critical variables,” Jane says.

Jane, who grew up on a mixed cropping and cattle farm, has built a career with a clear purpose: helping primary industries build resilience as the climate changes.

“The results of our work show we have more opportunities than we might first think, especially in agriculture,” Jane says. “SEED can help more people see how to make the most of those opportunities and respond to new challenges.”

SEED Map interface displaying Radiata pine climate suitability results (RCP8.5)

SEED Map interface displaying Radiata pine climate‑suitability results (RCP8.5) 

NSW Flood Data Portal datasets are now available via SEED

Published on 16 September 2022

Hunter Valley Flood Mitigation Scheme_Photo by John Spencer DPE

SEED has partnered with the NSW Flood Data Portal (FDP) to syndicate and connect over 2300 publicly available flood-related datasets and over 120 organisations to SEED.

The SEED portal centralises the place where the community and government come to search for, access, contribute, and share environmental data. Having NSW flood data accessible via SEED enhances the visibility of critical information which can be found alongside other important environmental data. This streamlines discoverability and ultimately empowers scientific research and evidence-based decision-making.

FDP records are searchable in the same way as for any other SEED datasets, and can be found using the ‘Disaster’ category on SEED. However, resources in the FDP records can only be accessed directly via the FDP – Click on the resource on SEED and you will be linked to the FDP to download.

Please note, local councils remain the primary source of flood information for their service areas.

Flood data portal and SEED dataset

Link to the ‘Disaster’ category is here.


[Header image: John Spencer/DPE]

The NSW Coastal Erosion and Inundation Assessment 2025 is now available. 

Published on 25 February 2026

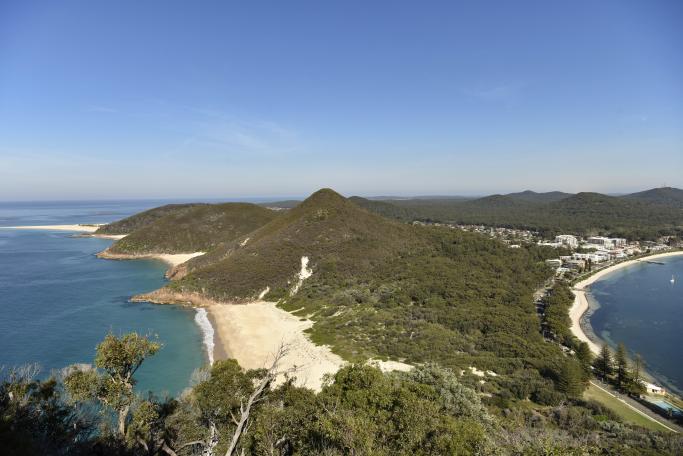
Lakes Beach by Chris Drummond, copyright DCCEEW

The dataset represents the best available statewide assessment of coastal erosion and inundation hazards under sea-level rise projections.  

It marks a major step forward in enabling evidence-based climate adaptation and disaster risk planning across NSW, supporting local councils, NSW Government agencies, and planners in identifying vulnerable assets and designing locally tailored responses. 

The assessment uses high-resolution seabed mapping, marine LiDAR, wave modelling, and the latest sea-level rise projections from the Intergovernmental Panel on Climate Change. 

The Assessment provides us with clear insights: 

  • Sea level rise is occurring now and will continue for centuries, irrespective of emissions reductions, due to continued ocean warming and melting of ice sheets. 

  • NSW’s growing exposure to coastal hazards for most asset classes begins accelerating from one to three decades. 

  • We need to act now. Adaptation measures take time to implement and take effect, and disaster costs will continue to rise in the meantime. 

You can access the data package and spatial viewer right here on SEED in the Future Climate & Adaptation Hub.   

Explore detailed findings in the technical report and coastal hazard snapshots on the Adapt NSW website. 

Coastal over wash by Darwin Brandis

Happy World Soil Day - Explore soils near you!

Published on 5 December 2022

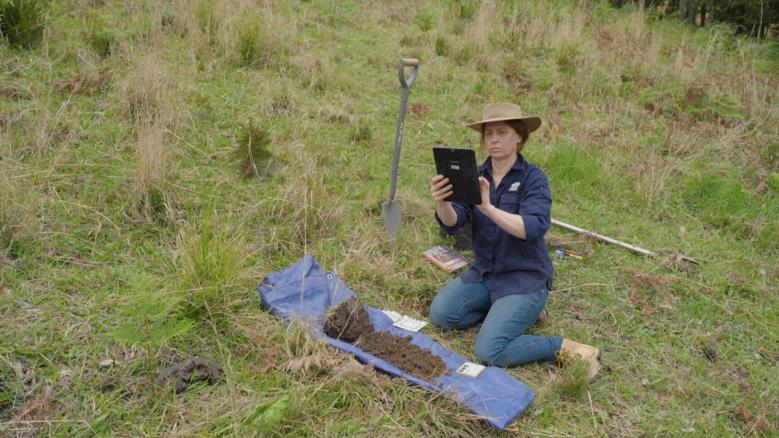
DPE soil scientist collecting and recording soil data in the field


World Soil Day is celebrated on 5 December each year to reflect on the importance of soil health, and support the sustainable management of soil resources.

Scientists from the Department of Planning and Environment (DPE) have developed an app to make important soil information accessible to the community.


Introducing Soils Near Me NSW, a soil data app

Soils Near Me NSW is a new app that brings soil information to the community in a simple and practical way.

Soil plays a vital role in the production of the food we eat and fibre for our clothes. The quality and quantity of our water supply is also intrinsically linked to the health of our soils.

Why we care about soil

Most of us tend not to think about soil very much - it’s that brown stuff that keeps the plants standing up in our gardens, stops our houses from falling down and that our kids and dogs like to roll around in. Soil plays its greater role in the environment silently, often invisibly and (generally) very slowly.

Senior Scientist Humphrey Milford says “Managing and preserving our soils is really important. To do that, we need to know something about those soils: where they occur, what their characteristics are, what land uses are suitable and which ones are not. If soils become degraded, how can we fix them? For all of these things - we need soil information.”

Scientists from the Department of Planning and Environment (DPE) and its predecessors have been collecting, analysing, storing, delivering and sharing soil data for over 80 years. In more recent decades, scientists, researchers and experts from other NSW agencies, universities and industries have also contributed to this enormous data set which is one of the largest in Australia and significant globally.

For many years, this treasure trove of soil information was available only to a small community of connected scientists. The latest step forward is the release of the Soils Near Me NSW app, available free for Android and Apple mobile platforms.

Accessing the 3 most popular soil datasets on SEED

Soils Near Me NSW draws on the three most popular soil datasets on SEED. These datasets are consistently found in the SEED Top 10 Datasets each month.

Dataset

Total views Nov 2022

Total unique users Nov2022

Australian Soil Classification soil type map of NSW

9,740

5,720

Acid Sulfate Soil Risk

4,900

3,350

Land and Soil Capability Mapping for NSW

2,730

1,780


Rigorous data you can trust

The app provides maps of key soil parameters directly to anyone managing or interested in soil in a simple, easy, and accessible form.

Soils Near Me NSW is underpinned by a suite of information systems, platforms and over 100 datasets. Our data aligns with rigorous nationally-standardised terms and methods and is based on many thousands of observations and millions of individual pieces of land and soil data.

Brian Jenkins, Senior Team Leader says “The Soil and Landscape Assessment Team are a small, but committed team that delivers soil data and information to meet the needs of the NSW government and community and can be relied on to make informed and sustainable land and soil management decisions.”

Download the app today and start exploring the soils near you!

Find out more      

Search Soils Near Me NSW in your favourite app store or go to the Soils Near Me webpage


[Header image: Peter Robey/DPE]

The SEED Map’s enhanced Layer Intersect Tool (LIT) upgrade is now live!

Published on 11 November 2025

The NSW State Vegetation Type Map has been revised to version C2.0M2.2 (December 2025).

The enhanced Layer Intersect Tool (LIT) provides a more intuitive user experience, expanded functionality, and increased flexibility in managing the tool. With a redesigned step-by-step interface, new geometry source options, removal of the restrictive area limit, and now offering compatible SEED Map layers, users can perform more customised assessments—unlocking data insights beyond biodiversity to any spatial data combination. 

The enhancements provide:

  • User Interface Redesign.
    The LIT interface has been modified to provide a step-by-step interface with clearer access to tool functionality and Simple and Detailed reports.
  • A new geometry source is added.
    An additional Area of Interest is added, “Select by location,” which allows SEED Map layer features to be used. High-value administrative layers, such as Lot, LGA, National Park, and Regional Planning Areas, will be made available.
  • Remove the area limitation of 2000 hectares.
    The new limitation is the number of records the LIT can process in an acceptable
    time. Users run a feasibility check to have an opportunity to refine the area of interest or choose a Simple Report if the area is too large. This allows large AOIs to be used in the tool.
  • Any compatible layer can be used in the LIT.
    A user can select any feature layers in the SEED Map to find ‘what is inside’ my area of interest. This expands the use of the tool from only Biodiversity Assessment analysis to any combination of SEED Map layers.


👉Explore the enhanced Layer Intersect Tool -SEED Map and find out more about how to use the Layer Intersect Tool | SEED Portal.