Search

The first update of Integrated BioNet Vegetation Data (IBVD) is now live

Published on 19 December 2023

NSW SVTM

This update incorporates new data and user feedback as part of the ongoing effort to continuously improve the NSW plant community type classification of the state vegetation type map. The update involves a revised PCT Master List (version C2.0, which includes 9 newly approved PCTs for eastern NSW and decommissions 4 PCTs) as well as a revised State Vegetation Type Map (version C2.0M2.0). 

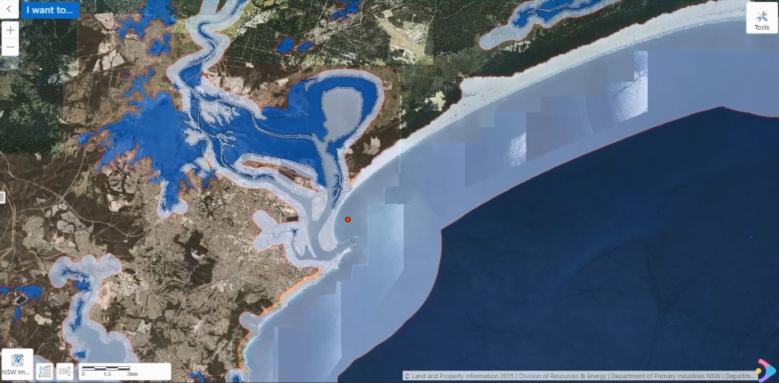
What do these changes look like? 

A summary of these changes and what you need to do is available here.

Feedback/Support  

You can provide feedback on the map through the Provide Feedback button in SEED.

For general support, please don't hesitate to contact the BioNet team at [email protected].


Welcome to our News & Resources hub

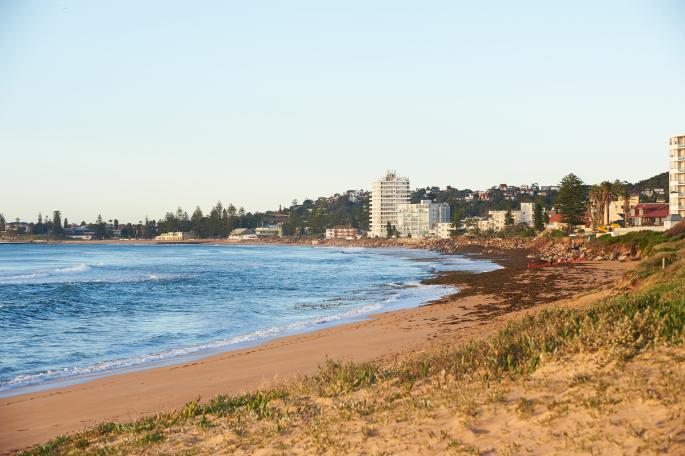
Beach environment

SEED welcomes you our News & Resources hub, where you can find the latest news, stay informed on upcoming events, and access resources about NSW environmental data.

This section contains:

  • Articles including latest news, updates, blog posts on featured datasets, new feature releases and more
  • Featured datasets
  • Upcoming events
  • Resources including fact sheets, videos and guides.

You can also subscribe to the SEED newsletter to stay in touch and have the latest news and upcoming events delivered to your mailbox.

SEED is a community resource and needs your feedback to help it grow. Let us know about any additional types of resources you would you like to see, including new features, functionality and queries about the quality and usefulness of individual datasets. This feedback will assist us in prioritising new resources and future development. 

Your feedback and suggestions for SEED are welcome and can be contributed via the Contact Us page.


[Image: John Spencer/DPIE]

Monthly featured tool: Interacting with data layers

Published on 20 November 2020

SEED map features

The SEED Map is a powerful tool designed for and in consultation with our users. It allows you to search, visualise and interact with environmental data.

Many of the datasets in SEED can be viewed and combined on the SEED map, providing a medium to visualise environmental data without requiring scientific expertise or specialist mapping software.

This month’s featured tool video highlights some of the main features and functions on the SEED map, including how to add and interact with multiple data layers, change what is visible and adjust the layer drawing order.

Watch this video to see how datasets can be viewed and combined on the SEED map and keep an eye out for more features coming to the map soon.


Monthly featured dataset story: Bush fire prone land

Published on 20 November 2020

Bushfire prone land

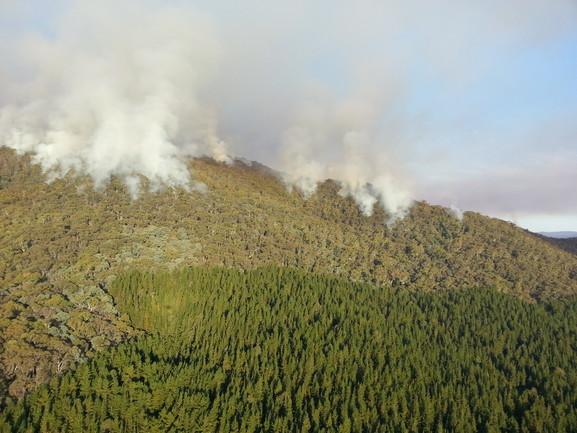
The 2019–20 bush fires in New South Wales have been one of the most extreme and widespread fires the state has experienced.

It is vital to be informed and plan for bush fire protection, so this month as we approach the fire season, we’d like to highlight the NSW Bush Fire Prone Land (BFPL) dataset.

BFPL is land that has been identified by the local council which are considered to be a higher bush fire risk. These maps are prepared by the local council and certified by the Commissioner of the NSW RFS.

When you access the BFPL dataset, you can check the data quality statement, read more about the guide for BFPL mapping, and display the data on the SEED web map.

The SEED map will load the dataset onto the map, with the legend details displaying to the left of the map.

Councils are required to map BFPL within their local government area, to ensure that people, property and the environment are more fully protected against the dangers that may arise from bushfires.

Watch this video to find out more and access the dataset to explore further.


[Header image credit: Ian Dicker/DPIE]
 

Happy World Soil Day!

Published on 4 December 2020

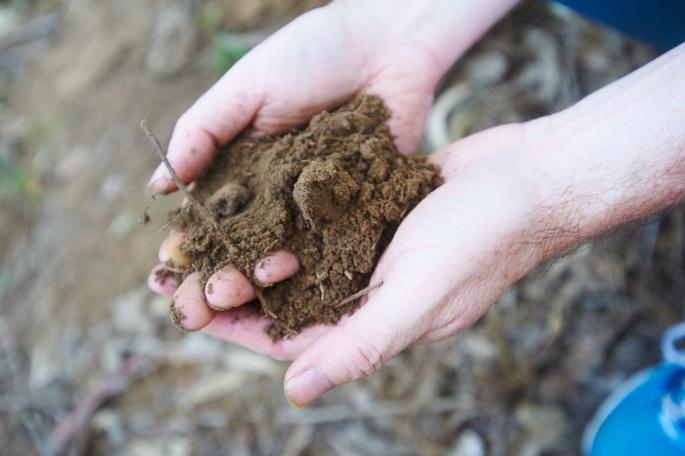
Soil profile sampling, testing, edirt program

5 December is World Soil Day, and a great opportunity to reflect on the importance of soil health, to support the sustainable management of soil resources.

This year’s theme is "Keep soil alive, protect soil biodiversity", which aims to raise awareness of the importance of soil in maintaining healthy ecosystems and human well-being. 

SEED provides access to a number of soil-related datasets for NSW and some are available to visualise via the SEED map.  

The below soil-related datasets are in fact part of SEED’s top ten most popular datasets:  

  • Acid Sulfate Soils Risk - This map identifies potential and known areas of Acid Sulfate Soils (ASS) along the coast of NSW and provides information that will assist land management and rehabilitation.
  • Australian Soil Classification (ASC) soil type map of NSW - This map provides soil types across NSW using the Australian Soils Classification at Order level. It communicates the dominant soil types that occur throughout NSW to support natural resource management and decision making.
  • Soil Landscapes of Central and Eastern NSW - This map is a compilation of all 40 published soil-landscape maps that cover central and eastern NSW. It provides an inventory of soil and landscape properties of the area, and identifies major soil and landscape qualities and constraints. 

Browse through SEED’s dataset catalogue for more soil-related datasets, to grow knowledge on soil resource management and support environmental decision making. 


[Image: Peter Robey/DPIE]

Featured dataset: NSW Air quality data

Published on 17 December 2020

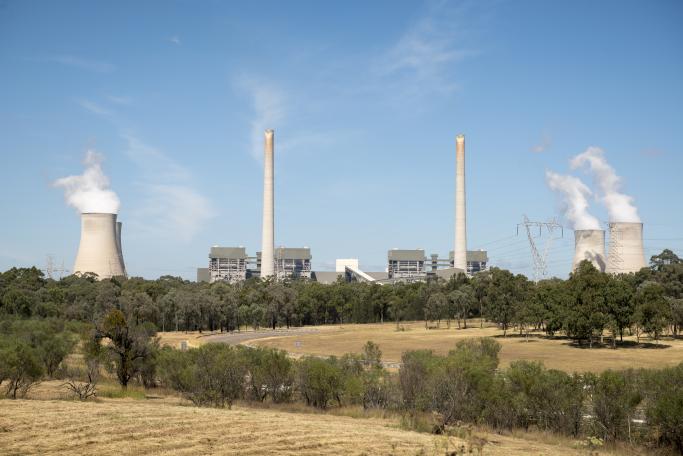
sydney air quality

NSW Air quality data is now available to visualise via the SEED map.

Air quality data services is the trusted source of air quality and meteorological data, and users can interactively view the data in real-time across the NSW air quality monitoring network.

Hourly averaged air quality and meteorological data can be viewed for the past 48 hours and last week in a table and chart.

Daily maximum and daily averages of air quality data can be viewed for the last month and last year in a table and chart.

Access to air quality and meteorological data supports communities, policy, research and decision-makers to improve environmental and health management outcomes.


Access the map here.

New developments of this dataset will be added early in 2021, including the availability of indicative site data, so stay tuned for updates.


[Header image: John Yurasek/DPIE]


Learn about beach water quality via Beachwatch

Published on 26 February 2021

Beach

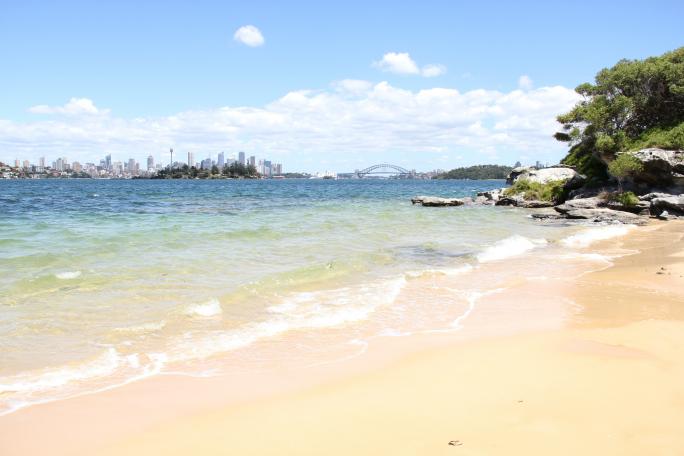
Beaches are a popular destination for Sydneysiders during warmer seasons, and through the Beachwatch program, you can access information about the water quality of your favourite beach. 

The Beachwatch monitoring program was established in 1989 in response to community concern about the impact of sewage pollution on human health and the environment of beaches across Sydney. It monitors and reports recreational water quality at swimming sites in the Sydney region, as well as partnering with councils and wastewater managers for regional swimming sites along the NSW coast. Water samples are collected and tested for bacteria, showing signs of faecal pollution, and whether it is safe for swimming.

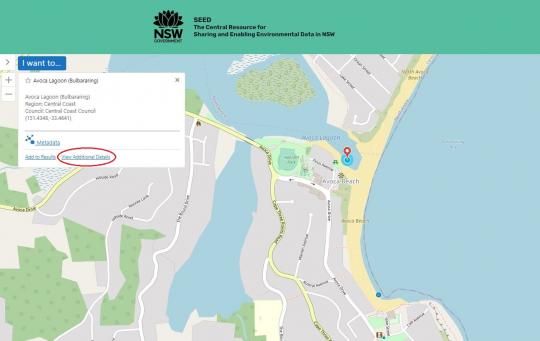
The SEED map allows you to navigate to a beach of interest and view the water quality information.

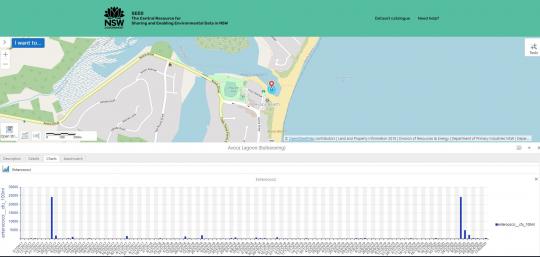
To access the data via the SEED map, click on a beach of interest and ‘View Additional Details’.

SEED map Beachwatch

The ‘Charts’ tab will show you the Enterococci data taken from water samples collected as part of the monitoring program.

SEED map Beachwatch Enterococci data

Beachwatch provides regular water quality information at swimming sites to allow anyone to access information about beach water quality. This dataset enables the community to learn about beach water quality, check whether beaches are safe for swimming, and supports environmental decision making.


[Header image: John Yurasek/DPIE]

Celebrate World Wetlands Day

Published on 2 February 2021

Happy World Wetlands Day!

World Wetlands Day is an annual celebration created to raise global awareness about the importance of wetlands for people and nature. 

Image
Celebrate World Wetlands Day

With the increasing concerns of freshwater crisis which threatens our earth and human well-being, this year’s theme, #RestoreWetlands highlights wetlands as a source of freshwater and the importance of restoring them to prevent their loss.

Wetlands are defined as “land areas that are saturated or flooded with water either permanently or seasonally. Inland wetlands include marshes, ponds, lakes, fens, rivers, floodplains, and swamps. Coastal wetlands include saltwater marshes, estuaries, mangroves, lagoons and even coral reefs.”    

(The Ramsar Convention)
 

SEED provides access to many kinds of wetlands data, available for direct download, through web services and/or visualised on the SEED Map. These datasets support environmental decision making and management of wetlands.

Below are the top 5 most used wetlands related datasets available on SEED. More information and other wetlands datasets can be searched via our dataset catalogue.

  1. NSW Wetlands – This project maps wetlands across NSW and can be viewed on the SEED map.
  2. Ramsar Wetlands of NSW – This dataset defines boundaries of wetlands designated under the Ramsar Convention in NSW. The Ramsar Convention is an inter-governmental treaty that embodies the commitments of its member countries to maintain the ecological character of their Wetlands of International Importance.
  3. SEPP Coastal management – Proximity Area for Coastal Wetlands This is a spatial dataset that identifies the proximity area for coastal wetlands of land up to 100 metres area around all mapped coastal wetlands, including all land zonings.
  4. Directory of Important Wetlands in Australia – This is a polygon coverage representing the wetlands cited in the "A Directory of Important Wetlands in Australia" Third Edition (EA, 2001), plus various additions for wetlands listed after 2001.
  5. Inundation Maps for NSW Inland Floodplain Wetlands – This dataset provides information on inland wetlands to support environmental water management.
 
[Header image: Melissa Hams/DPIE]

SEED Layer Intersection Tool

Published on 26 February 2021

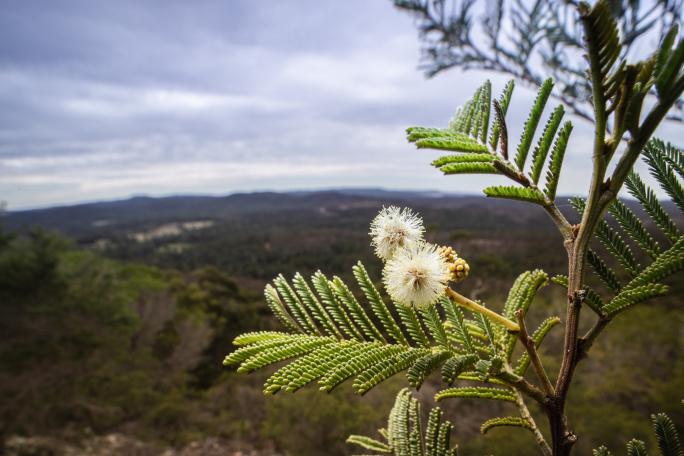
Narrabarba Wattle

The SEED Layer Intersection Tool (LIT) is now available to use on the SEED map.

This tool greatly improves efficiency as it allows the user to easily identify and analyse a focused set of map layers within an area of interest (AOI). Users can assess what layers intersect and download the output in detailed reports. This saves time and enhances transparency, by simplifying the process of finding, accessing and receiving data.

Currently, the Biodiversity Assessment Method (BAM) stage 1 layer group is available for use with the LIT. This means the LIT is beneficial particularly for ecological consultants who access data for biodiversity assessments such as the BAM. It supports users to apply the BAM (and other similar processes), improving assessment quality and ultimately enables users to use SEED as the central point to access NSW environmental data.

The layer groups used in the tool will be updated and expanded over time, meaning that the LIT will beneficial to a much wider audience in the near future. User feedback will actively be sought in developing these layer groups.

The LIT has been designed with and for users, and focused on continuous improvement.

Users can provide feedback on the tool and BAM layers through the 'Report an error/provide feedback' option on the SEED map or the enquiries and feedback page.

A fact sheet on the LIT is available for download.

Watch the video below to see how to use the layer intersection tool.


[Header image: Alex Pike/DPIE]

Featured tool: Exporting SEED map data

Published 24 March 2021

SEED map with layers

The SEED map allows you to search, visualise and interact with environmental data.

Many of the datasets in SEED can be viewed and combined on the SEED map, and can be exported as a spreadsheet or a shapefile.

Watch this video to see how to add layers to the map and export the data.


First NSW koala baseline survey results are now live | Koala Data Hub

Published on 01 May 2026

credit: Steve Anyon-Smith/DCCEEW

The first results from the NSW Koala Baseline Survey are now available, representing the most comprehensive estimate of koala populations ever undertaken in New South Wales. Delivered through a $20.5 million NSW Government investment, the survey improves our understanding of koala distribution, occupancy, and abundance, providing a robust statewide population estimate with a 95 % confidence interval. The results package includes summary and technical reports, raw survey data, and maps showing modelled koala occupancy and abundance across NSW. 

Koala Baseline on SEED

SEED Map - Koala Baseline 

For most users, the occupancy and abundance maps are the recommended products, supporting conservation planning and land management by showing where koalas are likely to occur and where densities are highest. Individual site data from passive acoustic recorders and thermal drone surveys are also available for advanced users to inform their own analysis, planning and management. 

The datasets and reports can be accessed via SEED, or viewed spatially on the Koala Data SEED Map by searching “koala baseline”, with further information available on the NSW koala baseline survey webpage, Discovering koala populations. 

Happy Citizen Science Month!

Published on 14 April 2021

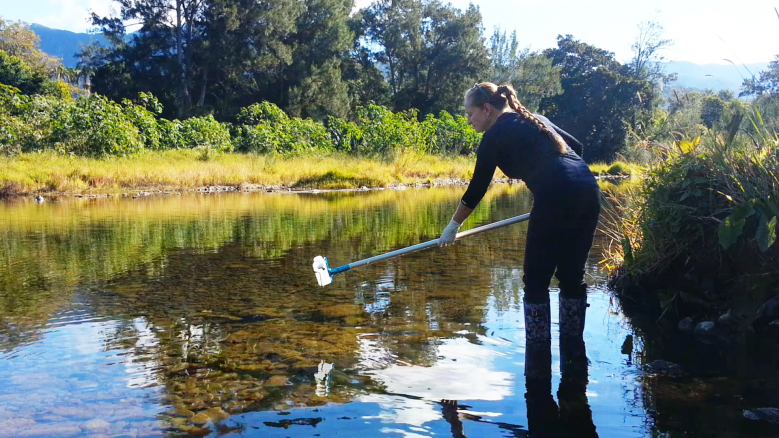
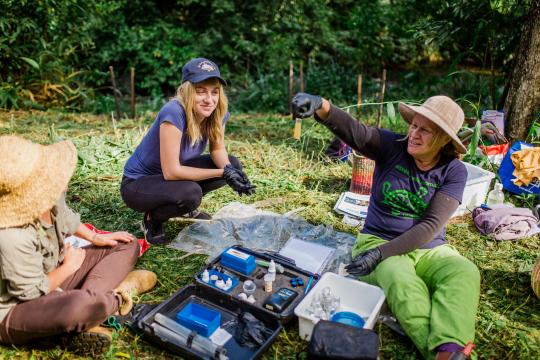
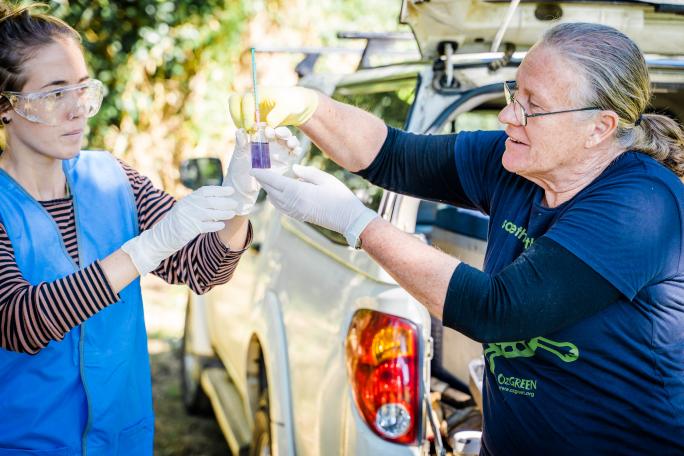
Citizen Scientist testing water quality as part of Bellingen Riverwatch

April is Global Citizen Science month, which recognises and celebrates the work of citizen scientists in our communities who participate in scientific research.

Citizen science is public participation and collaboration in scientific research with, or under the direction of, professional scientists and scientific institutions. It produces meaningful data which can be used for scientific research and decision-making. When you contribute to a citizen science project, you are a citizen scientist.

The SEED Citizen Science Hub has been set up to support and grow citizen science in New South Wales. The hub is a one-stop-shop for citizen scientists in NSW to explore, connect and contribute with projects, people and data. It provides many benefits for scientists and data users, project organisers and participants alike, including project registration and promotion, networking and data access.

Below are some of the popular citizen science projects that have data available via SEED. Projects on the hub have multiple ways to provide data, either linked through SEED or via external data repositories.

  • I Spy Koala - An app that allows community members to record their sightings of koalas in the wild.
  • Lake Brewster pelican banding – This project is to report sightings and learn more about the movements of Pelicans from Lake Brewster, in the Murray-Darling Basin.
  • Superb parrot monitoring – This project is to collect important population and distribution information that will contribute to the understanding, conservation and management of the superb parrot.
  • Streamwatch - Streamwatch is a long-running water monitoring program initiated by Sydney Water and the Sydney Catchment Authority, to enable community groups to monitor the quality and health of local waterways.
  • Bellingen Riverwatch – This program was created to provide consistent water quality data in the Bellinger and Kalang catchments, to support the recovery actions of the Bellinger River Snapping Turtle.
  • Community Wildlife Survey (NSW Government) - The NSW Community Wildlife Survey aims to improve our understanding of the distribution of koalas and other wildlife in NSW, to indicate how their populations have changed over time, and to investigate what might be causing that change.

Visit the SEED Citizen Science Hub to explore more projects. If there is data linked to the project, you can access and download data from the SEED platform.

If you would like to find out more or have a project you would like to showcase on the hub, please contact [email protected]

 
Citizen scientists testing water quality as part of Bellingen Riverwatch. Photo credit: Jay and the trees
Citizen scientists testing water quality as part of Bellingen Riverwatch 1

Citizen scientists testing water quality as part of Bellingen Riverwatch 2

 
[Header image: OzGREEN]

Planned maintenance on SEED

Published on 16 April 2021

SEED wishes to advise that there will be a planned system outage on Tuesday, 20 April 2021 at around 9:30am. These updates are necessary to improve performance and security.

We expect SEED to be unavailable for no more than an hour during this time. This means that you will not be able to load SEED, or any SEED map embeds on other web pages during this time. You will instead see a message stating that SEED is unavailable, which will be removed as soon as we are back online.

We apologise for any inconvenience.

If you have any questions or concerns at any time, please feel free to contact [email protected]

Celebrate the efforts of citizen scientists in the Bellingen Riverwatch project

Published on 22 April 2021

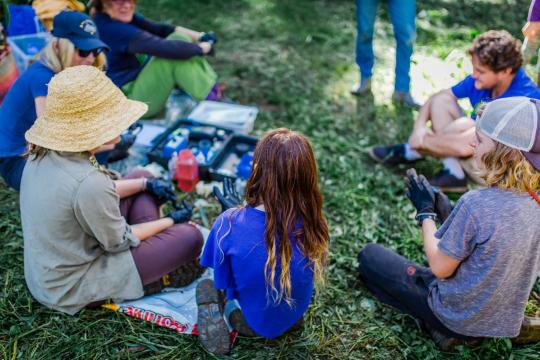
Bellinger Riverwatch volunteers testing for dissolved oxygen.

This April is Global Citizen Science Month and we’re celebrating the continued commitment of our citizen scientists in the Bellingen Riverwatch Citizen Science Program.

NSW Government’s Saving our Species program have particularly highlighted the efforts of Bellinger citizen scientists helping to save the Bellinger River snapping turtle, as part of the Bellingen Riverwatch program.

Bellingen Riverwatch is a program where volunteer citizen scientists collect data on the health of the Bellinger, Never Never, Rosewood and Kalang Rivers to inform conservation management of the critically endangered Bellinger River snapping turtle. Since 2017, Bellingen Riverwatch has engaged around 11 partners, 49 citizen scientists and 7 schools monthly to collect water quality data at 30 sites across the Bellinger and Kalang catchments.

Recent bushfires destroyed much of the vegetation protecting riverbanks in the upper Bellinger catchment. Subsequent high rainfall events have resulted in localised erosion and sedimentation, with unknown effects on water quality. Data collected by the Bellingen Riverwatch Citizen Science program prior to the bushfires are a valuable baseline for water quality monitoring that will now continue under funding provided by the Australian Government’s Wildlife and Habitat Bushfire Recovery Program. 

The NSW Government’s Saving our Species program is continuing to lead the Bellinger River snapping turtle conservation project. Key elements of this program include regular population monitoring of the turtles and restoration of riparian habitat.

In partnership with the Saving our Species program, the Bellingen Riverwatch citizen science program will continue supporting volunteers to undertake monthly water quality monitoring at over 30 sites across the Bellinger and Kalang catchments and extend the program to include macroinvertebrate monitoring.

The community-generated water quality data will not only inform on-ground bank stabilisation, erosion control and revegetation works, but will enable us to better understanding water quality in the Bellingen catchment before, during and after the 2019/20 bushfires. 

Bellingen Riverwatch is all about getting outdoors, learning new skills, meeting new people, and working together to contribute to a long-term data set that will help scientists build an understanding of the rivers' health and the changes that are happening to those ecosystems over time.

Bellingen Riverwatch is always looking for more volunteers to support this important program. Water quality testing is held on the second Tuesday or Wednesday of every month and macro invertebrate testing is planned to be held biannually in May and September. Volunteers must have access to a car and can register their interest by emailing Amy at [email protected].

You can find out more about this project on the SEED Citizen Science Hub or find out more about Bellinger River snapping turtle here.

The SEED Citizen Science Hub is the central hub for citizen scientists in NSW to explore, connect and contribute with projects, people and data. You can explore more projects, connect with other citizen scientists, share, access and download data via the SEED platform.
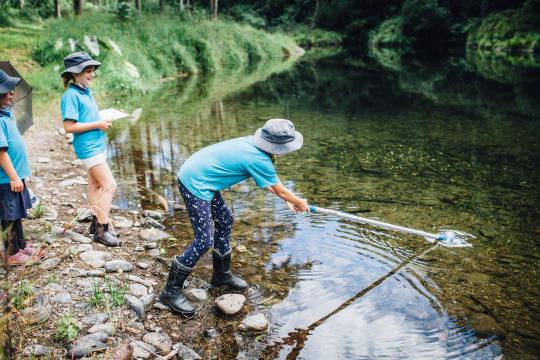
Citizen scientists testing water quality as part of Bellinger Riverwatch.

Citizen scientists testing water quality as part of Bellinger Riverwatch. [Photo credit: OzGREEN]
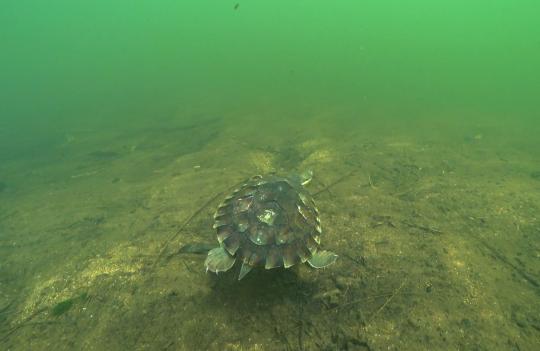
Bellinger River Snapping Turtle

Bellinger River Snapping Turtle. [Photo credit: Brett Vercoe/DPIE]

 
Article contribution: Saving our Species
Header image: OzGREEN
Enhanced feedback

Published on 21 July 2021

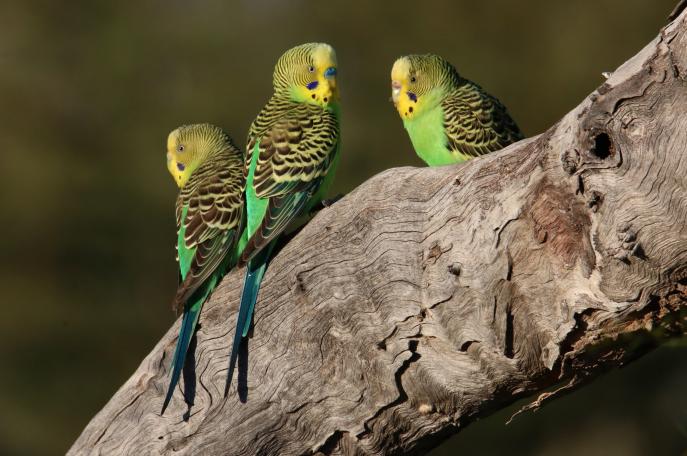
Budgerigars, Narriearra Caryapundy Swamp National Park_Courtney DaviesDPIE.jpg

SEED has improved the way you can provide feedback, allowing users to submit more detailed feedback or suggestions on the SEED map, dataset or tools.

Users are welcome to provide feedback related to tools, general functionality and missing datasets.

You can also provide comprehensive feedback, or proposed improvements on existing datasets. This can be done directly via the SEED map where you have your data layer area of interest loaded.

Please watch the video below for a demonstration on how to provide feedback, including ways to insert mark-ups, comments and supporting files.


SEED is focused on continuous improvement based on user feedback, so your suggestions are valuable to us. We are committed to providing a quality response and will continually work to improve our portal.


[Photo credit: Courtney Davies/DPIE]

Featured dataset: Fire Extent and Severity Mapping

Published on 22 June 2021

Air quality

Fire Extent and Severity Mapping (FESM) is part of ongoing work with scientists of the Department of Planning, Industry and Environment, and collaborative research being undertaken as part of the NSW Bushfire Risk Management Research Hub. This work is vital to improving fire management strategies and reducing the risk bushfires pose to people, property and the environment.

Remote sensing scientists from the Department developed the semi-automated approach to mapping the extent and severity of fires using satellite imagery and machine learning, in collaboration with the NSW Rural Fire Service.

Leveraging satellite imagery and machine learning, FESM rapidly delivers maps of fire extent and severity. Through FESM, users can classify and model fires, interpret how a fire has changed the landscape, and support on-ground actions, fire management and conservation planning. The system can assess a fire on the ground as soon as the fire is out and will classify the area into one of five severity classes.

This is an exciting development as previously fire severity information at a landscape scale was not routinely captured in NSW. FESM supported a range of key decisions during the 2019-2020 Black Summer fire season, when it was launched as a prototype. Now, it will help researchers better understand the impacts of fire on the environment and provide an important tool for decision support for fire management and post-fire recovery.

The first annual report and summary data for fire extent and severity mapping (FESM) has now been published.

FESM data for the past three fire years (2017/2018, 2018/2019 and 2019/2020) is now available on SEED. Access the dataset here.

Subscribe to SEED datasets

Published on 21 June 2021

Halls Peak

A new feature allowing users to subscribe to SEED datasets is now available across all datasets on the SEED portal.

Users can create an account and subscribe to datasets or SEED dataset filters, to be notified of updates to dataset changes, new or upcoming datasets, and receive announcements from SEED.

This allows users to be informed about changes to subscribed datasets before they impact dataset usage. It not only improves communication to users but also improves reliability with reduced downtime of SEED services, as administrators can send out messages to users subscribed to specific datasets and categories of anticipated changes, additions, broken links or downtime. Administrators will also receive notifications of broken datasets and attachments to fix them before they become an issue to users.

Users can select and tailor the information they receive, the frequency and the method of communication.

Live usage statistics are also available on datasets, allowing data custodians and users to monitor how the dataset is performing, and assess the popularity of datasets.

A help guide is available for step by step instructions on how to subscribe and manage your subscription preferences.


[Header image: Leah Pippos/DPIE]

Happy National Tree Day!

Published on 1 Augus 2021

Grassland near Nunnock swamp

National Tree Day is an opportunity to recognise the importance of urban greening and planting trees to create greener cities.

SEED is celebrating National Tree Day by highlighting the NSW Urban Vegetation Cover to Modified Mesh Block dataset. This dataset allows users to estimate tree canopy and vegetation cover in urban areas at many scales, such as mesh block, precinct, or the local government area.

Having current and accurate estimates of tree canopy and vegetation like this supports citizens and governments to reliably identify areas of tree canopy and confidently develop urban greening and heat island mitigation strategies and action.

Browse the Dataset Catalogue for more related datasets.

 
Header image: John Spencer DPIE