Search

Groups – themed search

Published on 30 June 2022

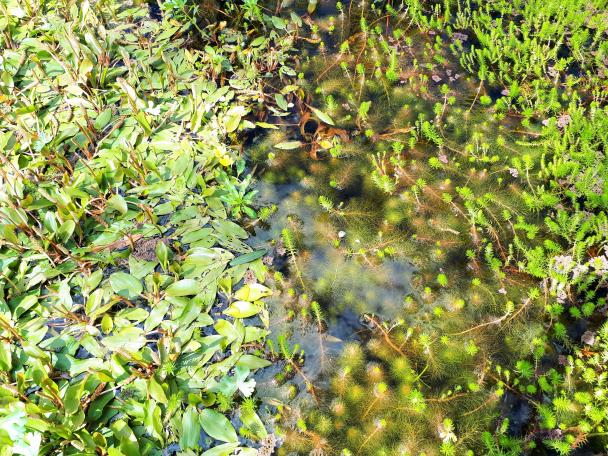
Wavy Marshwort

SEED has improved the way users can search for datasets, by grouping and cataloguing lists of datasets by different themes.

Grouping datasets by common theme makes it easier to search and find curated lists of data.

Themes for dataset groups can include topic, project, organisation or company, and groups can be catalogued for a particular project or team.

Watch the video below to view a demo on how to use the Groups function.


If you would like to request a new group, please submit a request via our feedback page. SEED is focused on continuous improvement and will use your feedback to build on our list of groups.


[Header image: Nicola Brookhouse/DPE]

Celebrating Citizen Science with DustWatch 

Published on 01 May 2026

Distant image of massive dust cloud

DustWatch is one of NSW’s largest and longest-running citizen science programs, playing a vital role in understanding and protecting our environment. 

Tracking dust activity across the state, the DustWatch database provides longterm PM10 dust concentration data collected from a network across NSW. Dust levels are a key indicator of soil and catchment health, helping scientists, land managers and policymakers better understand wind erosion, land degradation and environmental change over time. With data available from 2005 and continually updated, the dataset supports research, planning and evidencebased decisionmaking for healthier landscapes and communities. 

DustWatch also delivers real benefits close to home, helping people with respiratory conditions like asthma protect their health and supporting farmers to care for their land. 

This important work wouldn’t be possible without the dedication of citizen scientists like Terry Koen, Melanie Barnes and Sally Ware, who generously contribute their time and knowledge. 

As Citizen Science Month comes to a close, we’re proud to celebrate the impact of citizen scientists across NSW. 

Anyone can get involved! Learn more about joining Community DustWatch through Environment and Heritage and the NSW data portal.

The NSW State Vegetation Type Map of Plant Community Types is now available

Published on 29 July 2022

Vegetation mix

Update: As part of the release of the consolidated NSW State Vegetation Type Map, the older services are superseded. Web services in the following datasets will be removed in 14 days.

Affected datasets are:


The consolidated NSW State Vegetation Type Map (SVTM) is now available on SEED. This is the first comprehensive regional scale map of Plant Community Types (PCTs).

You can easily access the maps at one location, and the consolidation of the data makes it easier for users to access and navigate. This spatial data aids with strategic decision-making about vegetation management and conservation.

There are three key datasets for the SVTM:

Users are welcome to provide any feedback or report issues related to the vegetation maps.

Watch the video below to see how to launch and use the maps on SEED and a demo on how to provide feedback.

SEED is focused on continuous improvement based on user feedback, so your suggestions are valuable to us. We are committed to providing a quality response and will continually work to improve our portal.


[Header image: Nicola Brookhouse/DPE]

What is open data?

Published on Friday, 1 May 2026

Every day, decisions are made about the environment around you. Where to build, what to protect, how to respond to flood or fire. Underpinning all these decisions is data.

When data is open and treated as a shared asset rather than a locked resource, it supports better decision-making, sparks new ideas, and drives economic growth. Closed data, by contrast, is restricted to specific individuals or organisations for reasons of privacy, security, or commercial sensitivity. 

SEED is the NSW Government’s open data platform bringing together environmental data from across the state, making it freely accessible to those developing real-world solutions to real-world problems – the community, planners, university researchers and businesses. 


Image
open data


Our approach is guided by the NSW Open Data Policy and the Government Information Public Access (GIPA) Act, both of which set expectations for how government-collected data is shared and reused. As the NSW policy states, by making data open for all, it easily provides the intelligence for insight, intervention and exploration, translating into better products and services that improve everyday life and encourage business growth. 

Let’s explore further how SEED supports open data. 

The importance of open data

Research has shown that open data has a significant impact on four key areas: empowering people, creating opportunity, solving problems and improving government. 

In practice, this can mean better outcomes for vulnerable communities, safer roads, more accessible transport, stronger environmental protection and more transparent decision‑making. Open data also supports innovation by enabling new insights and ideas that may not have been possible before.

Internationally, it is seen as a measure of how governments are publishing and using open data for accountability, innovation and social impact.   

Data on SEED is open by default

SEED - Sharing and Enabling Environmental Data- is the NSW Government’s solution for open environmental data. The program contributes to achieving the NSW Open Data Policy principles in numerous ways, some examples are:

  • Open by default and protected where required: All datasets published to SEED have been approved by data custodians. They have regulatory responsibilities to promote transparency of government while balancing the need to protect sensitive information.
  • Prioritised, discoverable and usable: The SEED platform has been, and continues to be designed with the community to make finding the environmental data they need easy, meaning you do not require scientific expertise or specialist mapping software to find and gain insights from environmental data relevant to your needs. SEED also provides resources that help you to understand the data, and links to the data in various formats if you wish to download it.
  • Primary and timely: The metadata statement used on SEED uses the ANZLIC metadata standard for geospatial information. Every dataset available on SEED includes information (as part of a statement) that helps you understand when it was collected, when it was published and when it was last updated. It will also provide information on what data was collected, why and what file format it is available in.
  • Free where appropriate: Access to everything on SEED is free by default. This includes the data, metadata, and use of the tools and functions.
  • Well managed, trust and authoritative: Every user of the SEED platform can access information on the quality and limitations of the data available. A data quality statement provides information on how a particular dataset could be used and descriptions about the data to help you decide whether the data will be fit for another specific purpose. As a user of the platform, you can make assessments about the fitness of the data, depending on how you plan to use it. 
  • Subject to public input: The SEED team works hard to provide data in a way that is relevant to user needs. 
     

    Although SEED is not responsible for the data on the platform, it can help connect you to those who are, and enhance the user experience based on your feedback. 

    Get in touch by email: [email protected] 

Using the open data on SEED

People use SEED data in many practical ways, such as:

  • supporting planning and reporting for projects or programs
  • strengthening grant applications with reliable environmental evidence
  • informing community education or monitoring initiatives
  • contributing to academic or policy research
  • supporting business or investment decisions

Open data collected for one purpose can often be reused in new and valuable ways. 

Sign up for the SEED newsletter to discover stories and case studies on how SEED is being used in practical ways every day. 

The value of open data

Every environmental dataset on SEED represents an investment in fieldwork, expertise, time and potential. When data is made open, it becomes an asset that appreciates through reuse over time. 

A water quality dataset collected for a regulatory purpose becomes a baseline for a research study, a community monitoring program or even an investment decision. 

A dataset describing vegetation gains value because more use means more scrutiny, more derived insight, and more return on the original collection investment. 

Share with us how you are using data found on the SEED platform: [email protected]

Explore SEED

Explore SEED, download datasets, and see what insights you can uncover: Dataset | SEED

For more information on SEED, metadata, data quality statement or just about the datasets on the platform, check out our help pages: https://seed.nsw.gov.au/need-help


A faster way to publish your Data on SEED

Published on Friday, 1 May 2026

SEED is making it easier for NSW Government teams to publish high-quality environmental data, supporting transparency, reuse and better decision-making across the state.


The need to publish

For the NSW Department of Primary Industries and Regional Development (DPIRD), publishing the datasets behind the Climate Vulnerability Assessment was expected.

“Our decision to release the underlying data from our models was driven by scientific principles of transparency and by NSW Government open data policies. In short, it was a given that we would want to publish our data.”
David Allingham, Project Officer, Climate Vulnerability Assessment, DPIRD

Image
DPIRD - Climate Vulnerability Assessment

Around 50 datasets underpin the NSW Government’s Climate Vulnerability Assessment Summary Report. Together, they form a substantial body of scientific evidence, including maps and models showing how climate change may affect primary industries across the state.

Even before the report was released, there were requests for access to the data. Some datasets were published earlier in response to demand, while planning continued for broader publication.


Choosing the right platform

When it came time to publish the full collection, DPIRD assessed available platforms. SEED emerged as the best fit for the data and its intended use.

“We went looking for suitable systems to publish the open data in, and it quickly became obvious that SEED was the only logical choice. It contains environmental open data from across the NSW Government…It allows us to fulfil the FAIR data principles (findability, accessibility, interoperability, and reusability), making it easy for others to obtain the data and analyse it.” 
David Allingham

Image
SEED Data catalogue - DPIRD Climate Vulnerability Assessment Data


Publishing at scale

Each dataset came with five to six pages of documentation, making it clear that publishing nearly 53 datasets individually wouldn’t scale. After the SEED team published the first dataset and provided DPIRD with editor access, the team was able to manage publication themselves.

“From our point of view, this was ideal. We could quickly create datasets, fill in common metadata like project descriptions and timespans, customise individual fields such as model names, and upload the data.”
David Allingham

This self-service capability gave the team control over dataset creation and publishing, which was particularly valuable when working with large numbers of datasets.

“The self-service aspect was most appealing to us. It allowed us to work efficiently and at our own pace, while still ensuring every dataset met the required standards.”
David Allingham


Supporting confidence and reuse

Today, anyone can download the Climate Vulnerability Assessment datasets from SEED, see where the evidence came from, and apply it confidently in their own work. Making the full set of datasets openly available means users can explore the data behind the assessment, understand how it was produced, and reuse it alongside other information to ask new questions.

The datasets can support land use planning, agricultural adaptation and biosecurity planning as climate conditions change, helping decision‑makers respond using consistent, evidence-based information. By publishing trusted environmental data through SEED, agencies, researchers, and communities can work from the same evidence base, strengthening transparency and improving environmental decision-making across NSW.


Update on data services

Published on 15 September 2022

SEED image generic

Update on data services: Map of Critically Endangered Ecological Communities (CEEC) NSW Version 6.0

As of 5 May 2021, the map data in the Map of Critically Endangered Ecological Communities (CEEC) NSW Version 6.0 has been superseded for operational use by Threatened Ecological Communities Greater Sydney. The CEEC product is no longer being maintained.

Most data services for the dataset will be removed in 14 days. The SEED map will still be accessible and zip files will be available to download for reference purposes.

Contact SEED for any further enquiries.

Habitat Intactness and Neighbourhood Habitat Intactness updated to 2023

Published on 25 February 2026

Habitat Intactness and Neighbourhood Habitat Intactness indices were recently updated with new data that extends their coverage from 2017 to 2023. These layers support regional and state-scale reporting by providing our best state-wide estimates of habitat condition using satellite data at each 90-metre (grid cell) location across NSW.  

Habitat Intactness measures the quality of terrestrial habitats by estimating how intact habitat at each location is relative to a natural unmodified state. Neighbourhood Habitat Intactness considers how habitat loss and fragmentation effect the ability of species to move throughout the landscape by also measuring the connectivity of each location to surrounding habitats. 

The Biodiversity Indicator Program, State of the Environment and NSW Performance and Wellbeing reports use these layers as indicators of ecological condition and ecological carrying capacity. These indicators report the effectiveness of terrestrial habitats in supporting native species and ecosystems across the State. 

This update shows Habitat Intactness increasing across NSW by nearly 1% in 2023, with improvements of 2-5% across bioregions that were most impacted by the 2019–20 bushfires and preceding drought.  

Recent improvements allow for annual reporting but with a two-year time lag due to underlying data requirements. We’re also hindcasting these indices back to 1990, where available data permits. These measures can be adapted to support near real time, but less complete, monitoring when more recent insights are needed, as per the 2019–20 bushfire impact assessment. Both layers are now available to explore on the SEED Map. 

Contact [email protected] for more information. 

Habitat Intactness updated to 2023 -map


Biodiversity Credits Market Sales Dashboard

Published on 1 September 2022

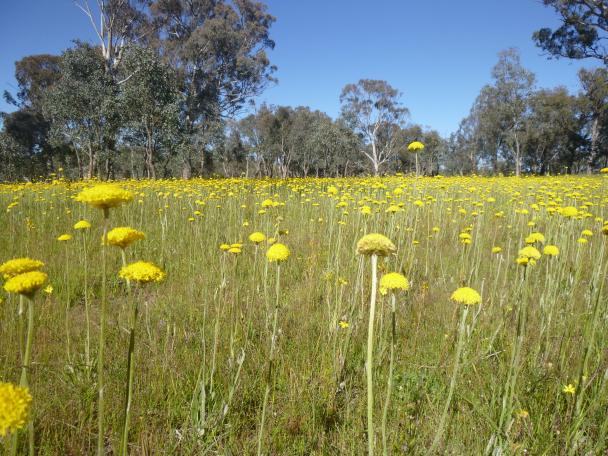
Yass Daisy

The Biodiversity Credits Market Sales dashboard is now available on SEED.

This dashboard contains data relating to all biodiversity credits created under the Biodiversity Assessment Method (BAM). It is a searchable, visual tool that allows users to view historical sales and market trends, in a single location.

The BAM Sales Dashboard presents a market overview, the latest prices for ecosystem credits and the latest prices for species credits. It can be used to support:

  • considering the feasibility of a Biodiversity Stewardship Agreement
  • business planning for developments
  • costing or pricing biodiversity credits.

You can find more resources including example scenarios and uses, FAQs and user guides on the dashboard page.

There is a short survey on the final page of the dashboard. Your feedback is important to us and will be used for continuous improvement. Please submit your feedback via the survey.

Watch the video below to see a comprehensive demonstration on using the dashboard.

Download a copy of the video transcript

[Header image: Laura Canackle/DPE]

NSW Net Zero Emissions Dashboard

Published on 12 August 2022

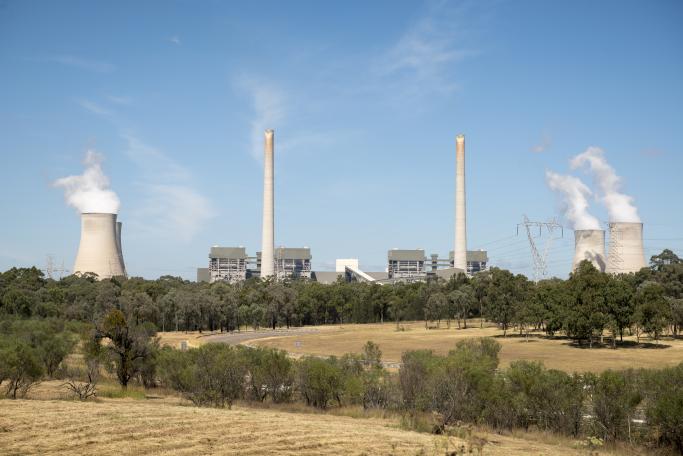
Muswellbrook Clean Air Project

The NSW Net Zero Emissions Dashboard is now available on SEED.

The dashboard provides detailed insights into NSW emissions trends from the past, now and into the future, and how NSW is tracking toward our Net Zero emission targets.

It presents information on the different sources of emissions in NSW and how they contribute to different greenhouse gases over time.

It also provides detailed emissions data for local government areas, which is the first comprehensive local-scale greenhouse gas emissions data published across NSW. You can explore emissions data in your local area to understand sources and trends of greenhouse gases.

The NSW Net Zero Emissions Dashboard will assist state government, local government and industry sectors to assess the impact of their emission reduction programs over time and target initiatives that will have the greatest contribution toward reducing local emissions.

Access the dashboard here.

Two videos are available to watch:

  • How to navigate the NSW Net Zero Emissions Dashboard
  • NSW Net Zero Emissions Dashboard – Report contents


[Header image: John Spencer/DPE]

How does data help shape what we grow in the future?

Published on 25 February 2026

cherries - copyright DCCEEW

Until recently, climate data and supporting interpretation have been hard to access, difficult to compare across regions and commodities, and challenging to translate into real‑world planning.

For the people making decisions about land use, food security and biosecurity risks, the evidence was not always available.

The NSW Government’s Climate Vulnerability Assessment for Primary Industries project has changed this.

One small, multidisciplinary team has translated complex climate science into a consistent, statewide evidence base that planners, industry and government can use.

The result is a detailed analysis of climate risks and opportunities across key commodities and biosecurity threats, built through years of modelling and collaboration with more than 260 industry, academic and government experts.

Crucially, the data won’t stay locked inside reports.

By making the Climate Vulnerability Assessment data freely available on SEED, the NSW Government’s platform for Sharing and Enabling Environmental Data, these insights can be downloaded, mapped and used by others.

Planners can pull the spatial layers into their own systems. Industry participants can test future scenarios. Academic researchers can build on a shared, comparable baseline.

“Our team came from different academic backgrounds, but we shared the same frustration – finding valuable data and not being able to access it,” says the Climate Vulnerability Assessment Acting Project Manager, Dr Jane Kelley. “As scientists, we wanted to provide open‑access data, because that’s what helps us all make better decisions about the future.”


What the data tells us

Understanding how a commodity or biosecurity risk responds to climate – and which variables matter most – is complex.

Take Cherries. The results show that cherry growing in NSW is likely to remain well‑suited to the climate through to 2050, but not without some adaptation. Warmer winters may reduce the winter chill cherries need to set fruit, and hotter conditions close to harvest can affect yield and quality. For growers, this may mean choosing different varieties, improving water management and using shade or protective covers to manage heat. At the same time, warmer temperatures could make new areas suitable for growing cherries and expand the industry.
 

Forestry provides another clear example. Before the Black Summer bushfires, NSW had more than 300,000 hectares of softwood plantations, with Radiata Pine contributing around $3 billion to the economy each year and supporting thousands of regional jobs. The Assessment shows that hotter and drier summers may reduce suitability for young trees in some areas, while warmer winters may reduce frost risk and create opportunities in others.

“With data that shows us how the plantation estate may change out to 2050, forest managers can think strategically about replanting, management practices and building resilience under future conditions,” says Jane.

Biosecurity is another important application. The Assessment covers risks such as crop diseases, horticultural pests, invasive weeds and livestock parasites. In the case of the Cattle Tick, the Assessment found that rising temperatures are likely to expand the areas where the parasite can survive. “That evidence helps us evaluate current biosecurity policy and consider how it may need to change in the future,” Jane notes.

Planning is a further example. Spatial layers published on SEED can be downloaded directly into Geographic Information Systems, allowing users to map and analyse the results of the Assessment alongside land use and hazards. “Agricultural planners can assess zoning decisions in the context of industry presence and climate suitability out to 2050,” she says, and this supports clearer, more defensible decisions about agricultural activities and where productive land should be protected to support future food security.


From evidence to confidence

To create a statewide picture of climate risk and opportunity, historical climate records and future projections were combined with expert knowledge drawn from research literature, departmental specialists and industry practitioners.

“We engaged with more than 260 experts at key stages of the project to help define the critical variables,” Jane says.

Jane, who grew up on a mixed cropping and cattle farm, has built a career with a clear purpose: helping primary industries build resilience as the climate changes.

“The results of our work show we have more opportunities than we might first think, especially in agriculture,” Jane says. “SEED can help more people see how to make the most of those opportunities and respond to new challenges.”

SEED Map interface displaying Radiata pine climate suitability results (RCP8.5)

SEED Map interface displaying Radiata pine climate‑suitability results (RCP8.5) 

NSW Flood Data Portal datasets are now available via SEED

Published on 16 September 2022

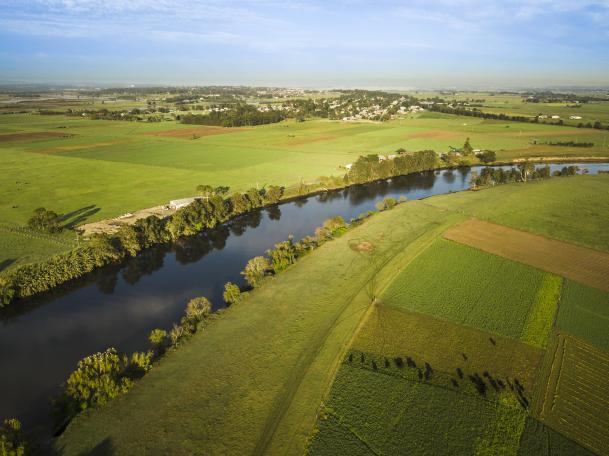
Hunter Valley Flood Mitigation Scheme_Photo by John Spencer DPE

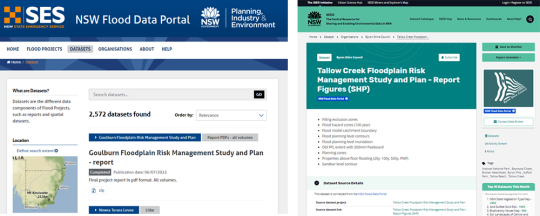
SEED has partnered with the NSW Flood Data Portal (FDP) to syndicate and connect over 2300 publicly available flood-related datasets and over 120 organisations to SEED.

The SEED portal centralises the place where the community and government come to search for, access, contribute, and share environmental data. Having NSW flood data accessible via SEED enhances the visibility of critical information which can be found alongside other important environmental data. This streamlines discoverability and ultimately empowers scientific research and evidence-based decision-making.

FDP records are searchable in the same way as for any other SEED datasets, and can be found using the ‘Disaster’ category on SEED. However, resources in the FDP records can only be accessed directly via the FDP – Click on the resource on SEED and you will be linked to the FDP to download.

Please note, local councils remain the primary source of flood information for their service areas.

Flood data portal and SEED dataset

Link to the ‘Disaster’ category is here.


[Header image: John Spencer/DPE]

The NSW Coastal Erosion and Inundation Assessment 2025 is now available. 

Published on 25 February 2026

Lakes Beach by Chris Drummond, copyright DCCEEW

The dataset represents the best available statewide assessment of coastal erosion and inundation hazards under sea-level rise projections.  

It marks a major step forward in enabling evidence-based climate adaptation and disaster risk planning across NSW, supporting local councils, NSW Government agencies, and planners in identifying vulnerable assets and designing locally tailored responses. 

The assessment uses high-resolution seabed mapping, marine LiDAR, wave modelling, and the latest sea-level rise projections from the Intergovernmental Panel on Climate Change. 

The Assessment provides us with clear insights: 

  • Sea level rise is occurring now and will continue for centuries, irrespective of emissions reductions, due to continued ocean warming and melting of ice sheets. 

  • NSW’s growing exposure to coastal hazards for most asset classes begins accelerating from one to three decades. 

  • We need to act now. Adaptation measures take time to implement and take effect, and disaster costs will continue to rise in the meantime. 

You can access the data package and spatial viewer right here on SEED in the Future Climate & Adaptation Hub.   

Explore detailed findings in the technical report and coastal hazard snapshots on the Adapt NSW website. 

Coastal over wash by Darwin Brandis