Finding and using data on the SEED map
Displaying Data and Charts
Displaying Data and Charts
How many datasets can I display?
There is no limit on the number of datasets that can be displayed at one time; however, more than five or so will make it difficult to see the data and slow the response rate of the map.
How to find details about specific features
When data is displayed on the map, use the ‘Find data on the map’ option under the ‘I want to…’ button to see more information about specific features. (This option is also available from the right-click menu.) Note that this option will not work unless you already have data displayed.
Once selected, you can draw a rectangle around the area of interest. Any features within the datasets that fall within the drawn area will be listed in the left hand panel:

Click on a title in the left-hand panel to view more details. To return to the list of features, click the ‘x’ (close button) in the top right corner of the left-hand panel.
How to filter and query data to show specific attributes
The 'Tools' button on the SEED map includes 'Query' and 'Filter' functions. These are similar in that both are used to find and display specific attributes within a dataset. Which one you use depends on whether you want to view the attribute in the context of the rest of the dataset.
For example, you may want to see which coal seam gas boreholes have been drilled by AGL. Using the ‘Query’ function, you can see all boreholes in NSW and identify the AGL ones amongst them. Using the Filter function, you can limit the display to only see the AGL boreholes.
Here's how to use the Query or Filter function:
- Display the dataset in which you are interested (as described earlier on this page).
- Select the 'Tools' button on the map, then either 'Query' or 'Filter'. The panel to the left of the map will display fields where you can define the required attributes.
- In the Data Source dropdown field, select the dataset you wish to query (for example, Coal Seam Gas Boreholes):
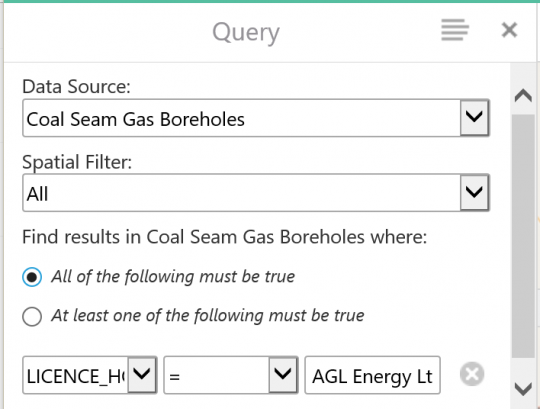
- In the next set of fields, select the attribute you wish to query/filter. These will change to match the Data Source previously selected. In this example, we have selected LICENCE_HOLDER. Then select an operator (for example "equal to" =), and then the attribute, which in this case is AGL:
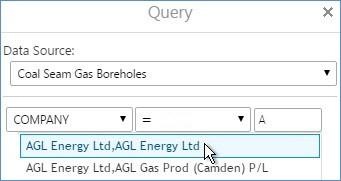


You can add more conditions by using the 'Add another condition' button to build up a set of attributes to query/filter.
Displaying data in expanded view: Charts and tables
Once you have used the 'Find data on the map' option to define an area, it becomes possible to view the data in an expanded table view. To do this, click the menu button (depicted by four horizontal lines), then select 'Switch to Table':

The data applicable to the location displays along the bottom of the map:

Use the menu button (four horizontal lines) again if you wish to switch back to a vertical data view.
Viewing dataset charts
You can view chart data in a similar way, watch the video below to get started.